You are viewing a read-only archive of the Blogs.Harvard network. Learn more.

Archive for July, 2013

The 6 things you missed if you didn’t attend the ICWSM Town Hall meeting

Wednesday, July 10th, 2013
Untitled

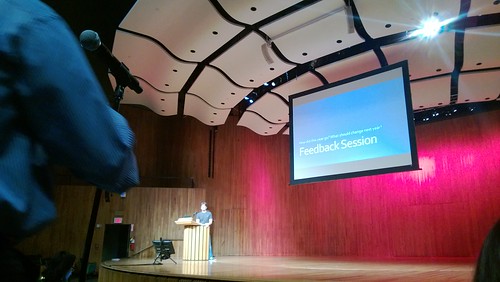
This post was written live and collaboratively during the town hall meeting using Newspad.

1. Growth in submissions, flat attendance, slightly cheaper

  • 349 papers, up from 232 last year.
  • Total attendance is flat.
  • Increased number of lightning papers.
  • No more “short paper” option (partly because lack of time for authors to turn around).
  • 3 papers were in the “without publication” option (out of 10 submissions).
  • Lowering price strategies: MIT dorms, no lunches, cheaper for students.

2. Where are the social scientists?

Mor Naaman (Rutgers) raised the issue that more social scientists are needed. He commended the conference for having social scientists in the program committee. He wondered if we need to convince people to attend ICWSM instead of ICA (International Communication Association). Someone else mentioned that maybe ICWSM could piggy back on a conference like ICA. Nicole Ellison (UM) thought that might be a great idea. Brian Keegan (Northeastern) raised the issue that ICA does not represent all of social science, and mentioned that other social science conference ask for more than an abstract in response to people wondering whether ICWSM should consider shorter papers. Topically, someone mentioned Sunbelt as yet another social science conference with overlapping topics. Ian Soboroff wondered if we spend too much time thinking how to make icwsm similar to other conferences. He says he attends ICWSM because it’s different. Lastly, David McDonald and Brian Keegan raised the issue of quality assessment as a mechanism to attract social scientists. David challenged the idea that rejection rates are a good proxy for quality, and asked what can, for example, tenure committees use for assessing quality. Brian asked if we could do bibliographic analysis of impact factors (e.g., if you publish at ICWSM you get more citations than other venues).

3. Submissions: Length and Additional Material

Merrie Morris pointed out that this year there was an option to allow 10 page papers instead of 8 (though 8 was still encouraged), and she wondered about the outcome of this. Emre mentioned that we do not yet have data  available  on how many people took advantage of the length increase but his guess was that most people used the 10 page option. One person mentioned that some conferences have no length limit. Winter Mason mentioned that social scientists might prefer to just submit a 2 page abstract instead of a whole paper. Bernie Hogan (Oxford) raised the issue of sharing data, and, perhaps more importantly, sharing algorithms and techniques. The use of open repositories for sharing our work was raised, Winter mentioned using Open Science Framework.

4. Format of the Conference

Brian Keegan asked for more opportunities to hack together to spark collaborations. Birds of a Feather was a good first step. Melroy De Souza (Bing), also advocated for having more opportunities for networking, and asked whether we could have virtual conferences. Emre replied that we do have an archive of all the videos of the presentations. Melroy also asked if we could have other presentations formats, such as panels with experts and practitioners. Michael Muller (IBM) commented that it was hard to share spotlight posters because the space was crowded. David McDonald (UW) commented that perhaps more than one track is necessary.

5. Future ICWSM’s

Planning to create a more formal steering committee, consisting of past papers and general chairs (though who is currently going to be on that committee not announced). Plan to begin planning conference two years out, though no announcement about who will organize 2014 or 2015 conference (they are soliciting nominees for who might do this). Informal plan to rotate more regularly between Europe and North America was mentioned, though no details on what that rotation will be like (every year? every N years?) or on locations for the upcoming conferences.

6. Thematic Suggestions

  • Focus on methods, and tools.
  • More applicable findings for real world (Melroy).
  • Surveillance is a topic where this community could make an important contribution (Roja from UCLA)

How is the Brazilian Uprising Using Twitter?

Monday, July 1st, 2013

By Andrés Monroy-Hernández and Emma Spiro

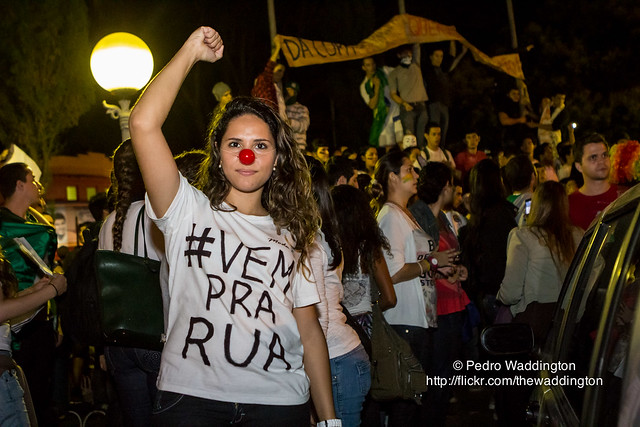
More than a million Brazilians have joined protests in over 100 cities throughout Brazil in the past few weeks. Since their early beginning as a “Revolta do Busão” (Bus rebellion) to reduce bus fares, the protests now include a much larger set of issues faced by Brazilian society. Protesters are angry about corruption and inequality. They’re also frustrated about the cost of hosting the upcoming World Cup and Olympic Games in light of economic disparity and lack of high quality basic services. Yesterday, as Brazil defeated Spain to win the Confederations Cup final, police clashed with protesters near Maracana stadium for the second time in two weeks.

English translation of “vem pra rua” video, via Global Voices.

People turned to social media to share what they saw on the streets and invite others to join in the protests. According to a well-known polling company, a surprising 72% of Brazilians online supported the demonstrations, and 10% claimed to have joined the protests on the streets. For a while, leftist President Rouseff maintained a high approval rate of 55%, down from 63% the year before and still one of the highest for any leader in the world. By June 29th, however, only only 30% of Brazilians considered her administration “great” or “good.”

Timeline

Although the Brazilian movement seemed to appear out of the blue the second week of June, the news about the bus fare increase first appeared in the media back in January. Furthermore, the organization behind the first protests, Movimento Passe Livre (Free Pass Movement), started 8 years ago and had organized an initial demonstration with students on May 28th in preparation for a bigger one on June 6th that attracted a few thousand people. At that point, the protest’s presence on social media seemed to have been constrained to MPL’s blog and the Facebook event for the demonstrations. This changed after the demonstrations were faced with police repression and several videos of people being injured by police were spread on social media. The movement started to gain a lot of attention on Twitter and Facebook and quickly spread to more Brazilian cities. See the following timeline for a longer list of events related to the protests.

Measuring Twitter Activity in the Brazilian Protests
In order to better understand the development of the protests in social media, Twitter in particular, we collected the full set of 1,579,824 tweets posted between June 1st and June 22nd containing the following hashtags: #VemPraRua (Come to the streets), #MudaBrasil (Change Brazil), #ChangeBrazil, #ChangeBrasil, #passelivre (Free Pass), #protestosrj (Protests Rio de Janeiro), #ogiganteacordou (the giant awoke), #copapraquem (Cup for Whom), #PimientaVsVinagre (Pepper vs Vinager), #sp17j (Sao Paulo June 17), , #consolação, and #acordabrasil (Wake Up Brazil).

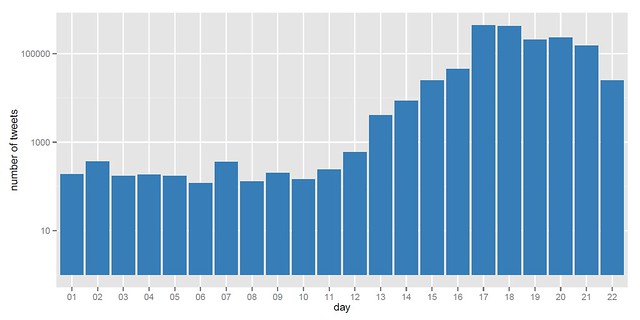
Tweets per day

Above we show the total number of tweets posted each day. We continue to analyze the data, hoping to expand beyond those hashtags, but here are three things we have found so far:

1. Protests’ tweets peaked on June 17th


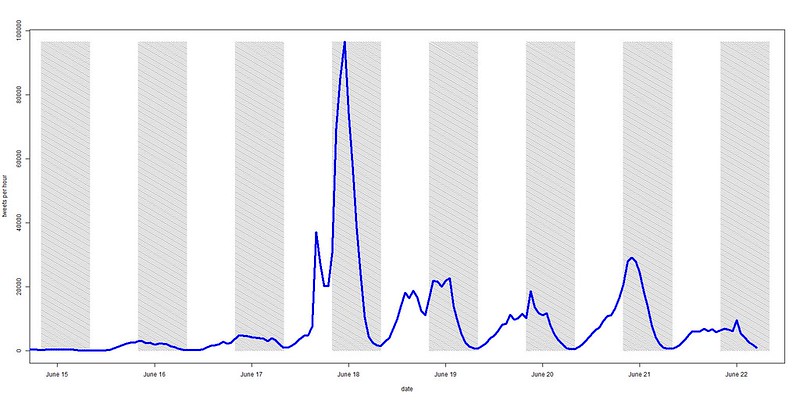
The peak of 96,531 tweets/hour happened specifically around 8PM local time on June 17th, 2013. This was the day protesters swarmed the Brazilian Congress. One example of a highly retweeted message this day was one from @AnonymousBrasil reporting on the protesters’ occupation of congress:


Tweets per hour – June 15th to 22nd

In the figure above, we show the hourly rate of tweets during the period of interest. Time of day seasonality is clearly visible as well as the dramatic spike in conversation on the night of June 17th. We also look at what is being talked about on Twitter. Below are some of the most commonly used words.

Most common words in the tweets of June 17th

2. International nature of protests.


Half of the tweets came from users whose time zone is set to “Brasilia” while the rest came from a wide range of other locations. The top time zones outside Brasilia were: Santiago, Greenland, Mid-Atlantic, Hawaii, Quito, Atlantic Time (Canada), Eastern Time (US & Canada), London, Pacific Time (US & Canada), Central Time (US & Canada), Istanbul and Buenos Aires.

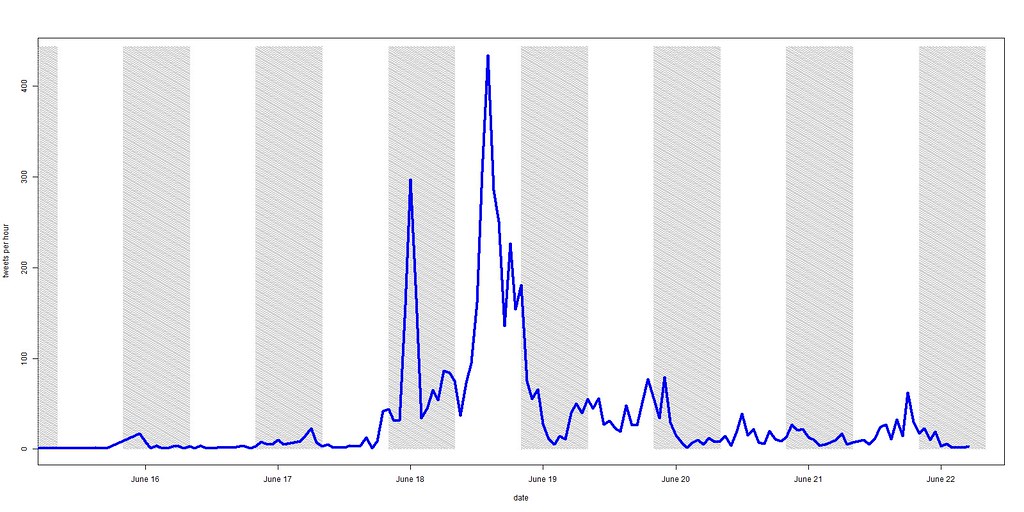
The relatively high proportion of users from Istanbul was particularly interesting given the similar protests going on in Turkey. The actual number of tweets from Istanbul was very small (5,582 tweets posted by 3,517 different accounts), but conversation rates follow a pattern of delay compared to the bulk of the tweets, suggesting that the tweets coming from Istanbul were posted after hearing the news of what was going on in Brasil (the tweets from Istanbul peaked at 434 tweets/hour on June 18th at 2:00 PM UTC) as seen in the figure below.

Tweets per hour from users whose time zone is “Istanbul” – June 15th to 22nd

The sign says “Turkey is here”, by Juliana Spinola via Demotix

3. Interactions network returns to its beginning.

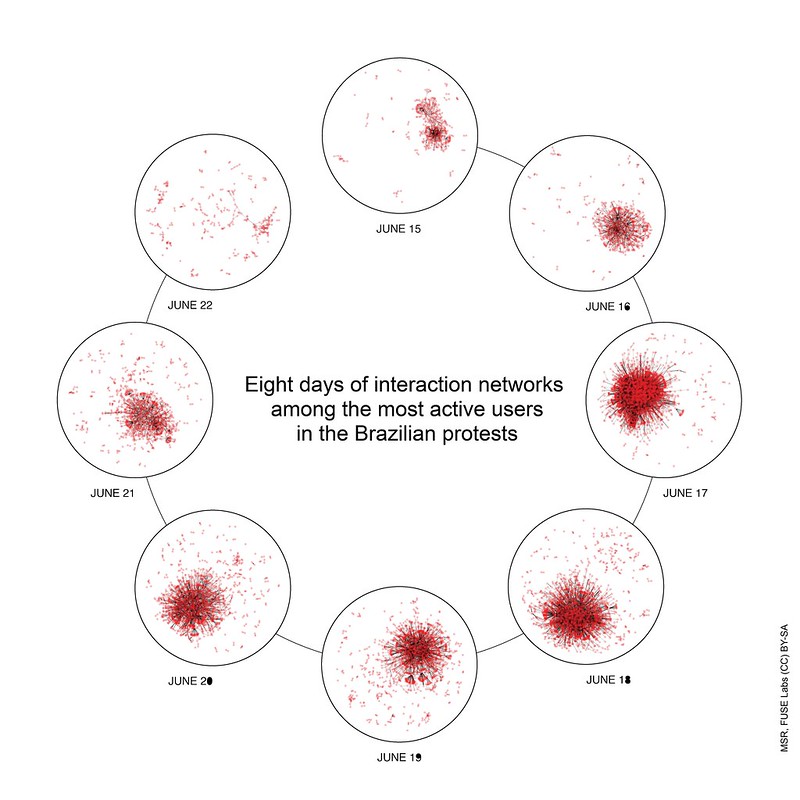
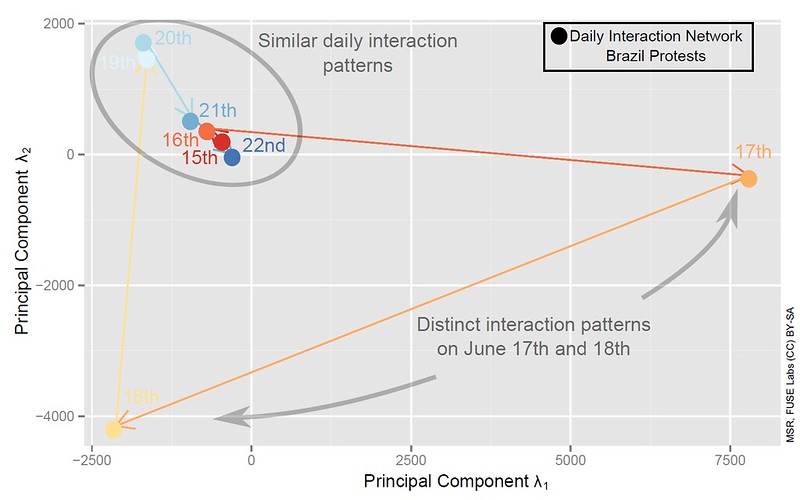
Perhaps the most fascinating finding is that the structure of the interaction network among the most active users–defined by the @mentions and retweets among the top 1% of users (those who posted at least 20 tweets in total)–exhibits cyclic behavior over the week. The interaction network begins very sparse on June 15th, grows to be more dense on June 17th, and maintains this increased density for a few days before returning to a density similar to its starting point on June 15th. The following plot shows how the volume of interactions among those in the 99% quantile grows and then shrinks.

Shapes of interaction networks over the course of 8 days (June 15th to 22nd)

Moreover, by comparing the structure of these daily interaction networks, we find that the pattern of relationships also exhibits cyclic behavior. In the second plot we show each daily snapshot of the interaction network as a point in space. The distance between points (i.e. daily interaction networks) represents the structural similarity between those networks – pairs closer in space are more similar. The plot demonstrates how the interaction network among these individuals begins in a particular configuration on June 15th/16th before changing drastically on June 17th and 18th (individuals on these days are interacting with many new contacts, with whom they did not previously communicate). By the end of the week, the network returns to a structural configuration similar to the way it began on June 15th.

Network structural dynamics diagram. Each circle represents a daily snapshot of the interaction network. The distance between points (two daily networks) represents their similarity – pairs closer in space are more similar.

Future work

This initial analysis represents an quantitative analysis of the movement’s communication on Twitter using a specific set of hashtags. More work needs to be done to not only expand to the list of hashtags beyond those we used but also to look into other communication channels such as Facebook and face to face interactions.

Future questions to investigate could focus on understanding the roles of each of those channels. Beyond that, the roles and motivations of different actors including unaffiliated individuals, students, and existing political organizations such as MPL, traditional political parties, and collectives like Anonymous.

Thanks to J. Nathan Matias for his valuable feedback during the writing this post, and Andrew Osborne for the help with some of the visuals.