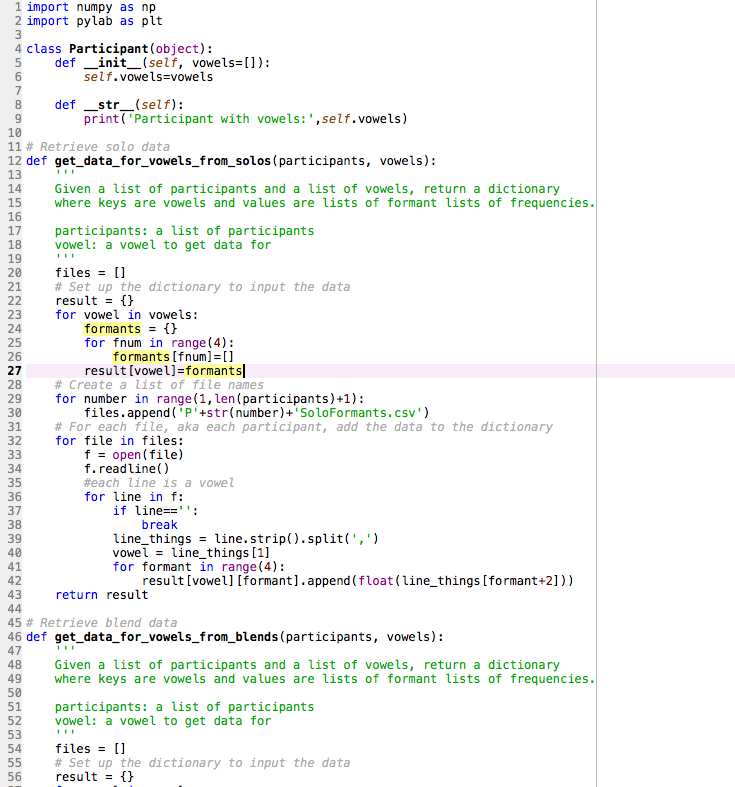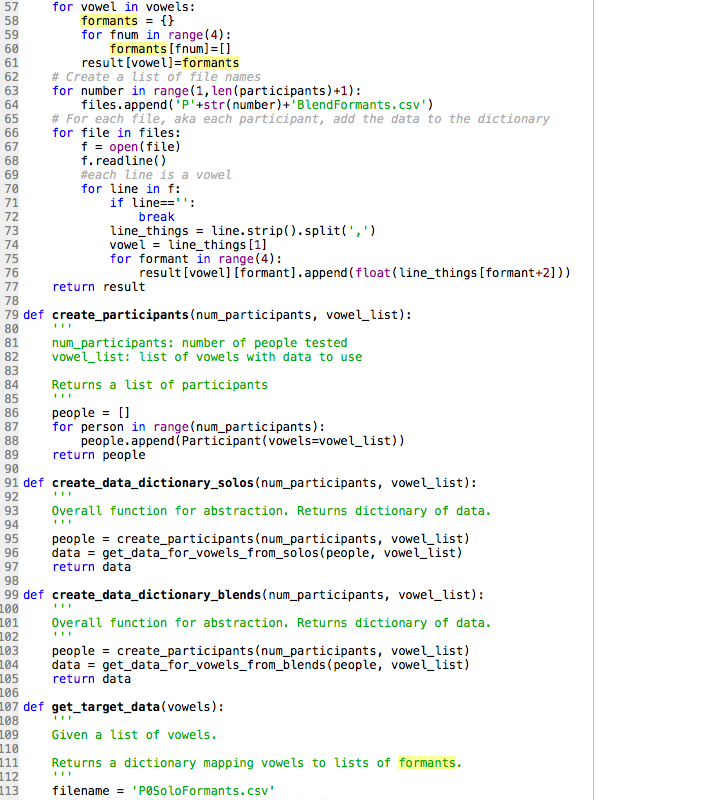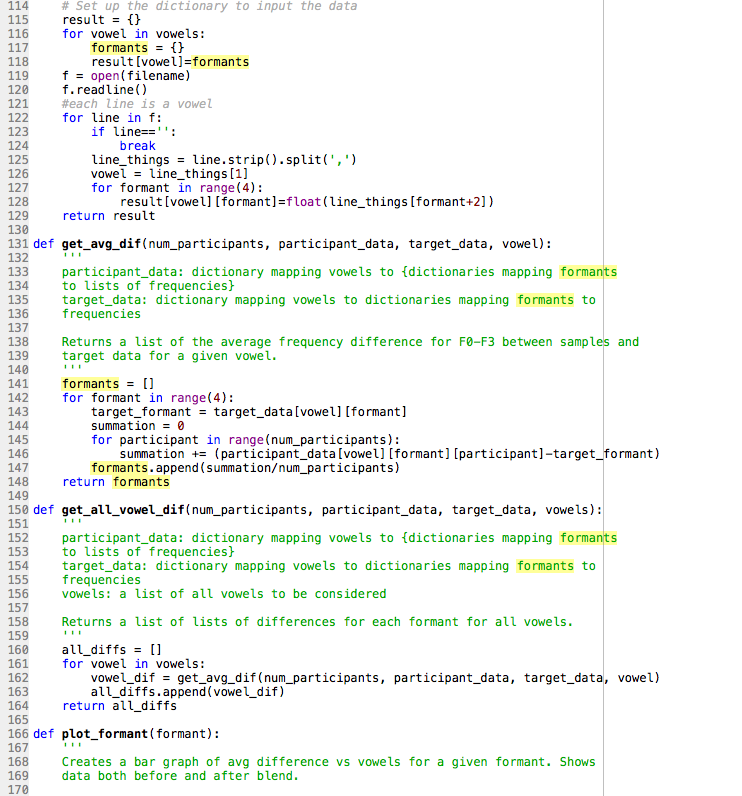
The following is my code to analyze the data and create the plots. I had to refer to some documentation: I needed to use a lot of the same code as one of my cited sources in order to graph two plots on one bar graph, and I also used some code ideas/code elements from one of my psets from 6.00 at MIT. However, I created most of the functions completely by myself, and I’m so proud to have created something functional for the first time using code. (Besides my psets and exams!)