You are viewing a read-only archive of the Blogs.Harvard network. Learn more.

Google Releases Transparency Report, Showcases Government Censorship Worldwide

On Tuesday, Google released a Transparency Report that shows the number of government inquiries it receives for information about users and requests for Google to take down or censor content.

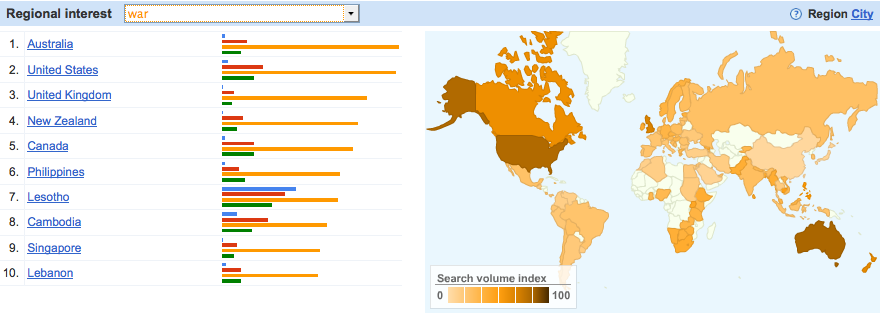
The report, which Google presents in the form of an interactive map and traffic graphs, reveals the number of content removal and data requests that it received from government agencies around the world during the first 6 months of 2010. (See this Herdict post on the traffic graphs.)

The map tool allows one to see:

  • The number of government requests we received to remove content, per country;
  • The number of individual items asked to be removed, per country (as there may be many URLs per request) — this is new for 2010 data;
  • The products that contained the content; and
  • The percentage of those requests that we fully or partially complied with on a country-by-country basis.

Internet censorship around the world is on the rise, according to the report. A comparison of data from the internet service database that it released 5 months ago and the current version shows that there has been an increase in the number of government requests, suggesting that internet freedom may be taking a turn for the worst. Note: the map tool excludes data request information for a number of countries, most notably China and Iran. Using the traffic graphs, however, one can see how much traffic Google services get in those countries. The U.S. currently occupies the #1 spot with  4,287 government requests for data information during the first half of 2010. Directly behind it are Brazil with 2,435 and the U.K. with 1,343. Just five months ago, however, Brazil was in first place, the U.S. in second, and the U.K. in third.

While the report does contain important and telling information about censorship levels worldwide, the data that Google provides is not totally comprehensive and accurate. It fails to address a couple of major criticisms that arose when it first released an internet service database. Most notably, the  tool does not reveal query specifics, such as how many requests government agencies made for the same user data and what the total amount of requests across all categories of content is. Google also admits that among its limitations is the fact that that it has not included statistics for countries in which fewer than 30 requests for user data in criminal cases during the observation period.

Moreover, the report does not account for government-mandated service blockages—only content removal requests. A major addition that Google has made to the tool, however, is the ability to see how many requests it has honored: 138 in the US, 398 in Brazil, and 48 in the UK.

Google says that it would  like to be able to share more information with the public, but lack of standardization among user data requests, as well as the difficulty in categorizing and quantifying those requests, prevent it from doing so. But the internet search giant has expressed its intention to offer more information in the future, as well as a desire to fuel debate on government censorship.

“We hope this step toward greater transparency will help in ongoing discussions about the appropriate scope and authority of government requests,”  Corporate Development and Chief Legal Officer David Drummond said in a post on Google’s official blog.

Posted in Free Speech, Tech Tools. Comments Off on Google Releases Transparency Report, Showcases Government Censorship Worldwide

Twitter sees strong growth in Russia

As I wrote last week, Twitter is starting to expand beyond its English-language roots in the US. Yesterday the Russian search engine Yandex released a short fact sheet on Russian language Twitter users. Here are the highlights (via Nick Wilson):

* Yandex estimates 183 thousand Russian accounts on Twitter
* More than 60% of Russian-speaking users update their Twitter stream every day
* 67% of all Tweets contain links, 8% of Tweets contain links to the media.
* During the winter 2009-2010 the number of Russian-speaking users on Twitter has
increased by 42%. In the year period from March 2009 to March 2010, by 26%.
* About 150 thousand Tweets (messages) are posted each day in Russian. 5% of them are ReTweets.
* There are more than 125 thousands links published on Twitter each day.
* Yandex studies more than 20 microblogging services in RuNet. Every day, more than 2 millions entries are made.

Perhaps most interesting is how strong the growth is during the winter compared to spring – gotta do something during those long Russian winters I guess. Yandex has also created a list of the most popular Russian Twitter users. Not much on the substance of the discussions taking place, but we are starting to dig into that now.

50 Million Tweets a Day

twitter growth

According to the Twitter blog, last year Twitter use grew by 1,400%, and now there are over 50 million tweets a day, or 600 a second on average. Our friends at the Web Ecology Project have done some of the best early research on Twitter. While #iranelection was a major story in 2009, it pales in comparison to the number of Tweets about Michael Jackson’s death (78 per second at its peak) over a similar two week period. In fact, it appears that Jackson’s death actually sucked all the air out of the Iran election discussion on Twitter, according to what Ethan Zuckerman tells me based on Media Cloud data.
mjtweetrate2-1024x682
While this remains primarily an English language and US-centered technology, it has been interesting to see the growth of other languages, including Russian, which we are digging into more deeply, (to say nothing of the strength of Malay(!) on Twitter). The Russian search giant Yandex already has a number of Tweeters among their top 1000 bloggers, and they reported last year that microblogging platforms have seen impressive growth, led by Twitter but also including Juick, a Jabber application. Whether or not all of this is a good thing we’ll leave up to others to debate, but it seems that the people are voting with their feet on this one.
twitter languages
Hat Tip: The Daily Dish

Google’s “Broken Windows” Investment

Partnering with the U.S. Department of State, Google recently announced a plan to digitize the Iraqi National Museum’s artifacts. Google CEO Eric Schmidt made the announcement in Baghdad. In a November 24th New York Times article, U.S. Ambassador Christopher Hill is quoted as saying that the project is “part of an effort spearheaded by the State Department to bring technology to Iraq.” Since the outset of the Iraq War, over 15,000 artifacts have allegedly been stolen, or gone missing. The Google digitization project, already 14,000 photos underway and due for release in 2010, will provide greater transparency, and share the wonders of Mesopotamia with the online world. Google’s Iraqi National Museum digitization project, however, has even broader implications.

On the same day that Google made its announcement, the Iraqi government also announced the unveiling of its official YouTube Channel.  With 24,000 channel views, and over 400 subscribers already, the channel of the Iraqi National Media Center appears to be gaining quick traction.  It signals a forward-thinking acceptance of social media by the Iraqi government, and an aim for greater transparency and information sharing.

In a December 2 Ashoka Peace article, “What Can Social Media Do for Iraq?” author Priya Parker additionally makes a number of insightful observations about Google’s recent foray into Iraq. While this is a public-private investment partnership, it signals that creative innovation can also be compassionate, and that the ethos of investment in Iraq is undergoing tectonic shifts. Google’s announcement signals an opening salvo for business investment in Iraq, private capital investment that will have broad implications for macroeconomic stability, new infrastructure development, technology transfer, human capital capacity building, and job creation.

Moreover, as Parker explains, Google’s investment parallels the 1980s New York City Police Department’s tactic of mending broken windows to alter perceptions. Mending broken glass not only improves the neighborhood, but it changes how individuals perceive their surroundings, and in turn can alter human behavior. The Google investment is a start, and perhaps it will mend broken glass, fostering global appreciation for lost history, and creating the necessary normative change on the ground to impel peace.

Posted in Middle East, Tech Tools. Comments Off on Google’s “Broken Windows” Investment

Mobile Phones Easier to Find Than Food for World’s Poor

This news from Foreign Policy’s Joshua Keating is pretty amazing. He writes that:

We’ve reached a very strange point in human history when it is assumed that people who don’t have access to food will have working cell phones.

He points to an announcement by the UN that it will use cell phones to send $22 vouchers to Iraqi refugee families in Syria every two months. They are provided with special SIM cards for the transactions, and the vouchers can then be exchanged for staples such as rice, flour, lentils, chickpeas, and oil at selected stores.

Perhaps expecting that eye brows might be raised at the idea that those needing food aid would have cell phones, the UN’s Emilia Casella reports, “all the 130,000 Iraqi refugees currently receiving food aid from the agency in Syria have mobile phones.”

UN Dispatch’s Matthew Cordell further points out that, according to the ITU, “worldwide at the end of 2008 there were 4.1 billion mobile phone subscriptions, buoyed by developing countries, where two-thirds of those subscriptions were used.” Even if most of us look at ITU data with a fair amount of skepticism, that is a pretty phenomenally high number of cell phone subscriptions, and stories like this seem to indicate that the digital divide may be shrinking faster than many of us expected.

Google Translate Adds Nine More Languages

translate_logo
While there is still a lot of English content on the Web, the percentage is shrinking fast, and those that want to understand what the rest of the world is talking about online have a potentially powerful new tool on their hands with Google translate, which has just added nine more languages: Afrikaans, Belarusian, Icelandic, Irish, Macedonian, Malay, Swahili, Welsh and Yiddish.

Icelandic? Yiddish? Hugh?

It turns out that Google chooses languages based on the amount of content available in those languages, not the number of speakers of a language or foreign policy concerns. As the Google Research blog says:

We’ve found that one of the most important factors in adding new languages to our system is the ability to find large amounts of translated documents from which our system automatically learns how to translate. As a result, the set of languages that we’ve been able to develop is more closely tied to the size of the web presence of a language and less to the number of speakers of the language.

Still, I’m excited by the project and the promised improvement in translation capacity over time, if that turns out to be true, and was quite happy when they added a beta version of Persian to the mix of languages earlier this summer (maybe Google isn’t totally immune foreign policy considerations after all).

As someone who has invested a lot of time trying to learn a foreign language or two (Russian has been my primary war of attrition), I always felt comfort in the fact that machines will never be able to translate very well. The results from most machine translators are often more humorous than useful. So, I was fairly impressed at how fast Google translate churns out a translation, if not necessarily with the quality of the end product. While the translation is better than most machine translators, it’s still not good enough to use free of a basic understanding of the language you are translating from if you want anything more than a general sense of an article or blog post (at least in Russian – I understand the quality varies among different languages). Humans (at least for now) are still better than computers at some things – but I applaud Google’s efforts so far on this one.

The End of Social Networking, or Just Facebook?

The media’s love affair with Facebook may be officially over. As Virginia Heffernan writes in the Sunday’s New York Times Magazine:

Things fall apart; the center cannot hold. Facebook, the online social grid, could not command loyalty forever. If you ask around, as I did, you’ll find quitters. One person shut down her account because she disliked how nosy it made her. Another thought the scene had turned desperate. A third feared stalkers. A fourth believed his privacy was compromised. A fifth disappeared without a word.

Yet she admits that “the exodus is not evident” in the numbers, as the site is still adding users and had nearly 88 million unique visitors in July. Things, it seems, aren’t that bad.

But the more important question, in my view, is if Facebook, Myspace, and others like it are just the cool new toy that nobody wants to play with anymore, or is there something more enduring about social networking platforms. Given the number of new tools that have taken their own slant on social networking (Good Reads, for example), the benefit that many users still see in occasional, passive networking for professional or personal reasons and perhaps most importantly, the potential for sites to start to figure out how to sustain themselves or (gasp) turn a profit by selling targeted advertising or information on networks of users to sponsors (even if that commercialization will drive some away), I’d say the end isn’t here just yet.

We also shouldn’t forget that not all societies are equal when it comes to social networking. Italians are crazy about Facebook if my former colleague Corinna is any indication, and as we’ve written here recently, Russians are the top social networkers in the world, starting with vkontakte, initially a carbon copy of Facebook. And even before it was translated into Arabic, Facebook had over 9 million users in Egypt. Even if the US market starts to dry up, Facebook and sites like it have a number of overseas markets to grow into; that is if homegrown versions don’t get there first. In short, I don’t think we’ve heard anything like the death knell of social networking, or even Facebook. If only we could ponder the same thing about email.

Apture Increases Congressional Transparency

This week the burgeoning Silicon Valley start-up Apture announced further media integration possibilities by adding Google Street View to its suite of integrated multimedia options.  Apture enables website publishers to add depth to pages and easily surface hand-selected information to elucidate points and add clarity to journalism. These links allow publishers to incorporate multimedia links –Wikipedia, photo, video, audio, or map– that can improve accountability. Though many records are “public,” current access requires a skill and patience many lack. As “Aptures” on the net become more prevalent, their hope is that transparency and access to information will improve.

As used by the New York Times, BBC News, Washington Post, and Reuters, Apture efficiently enables media outlets to surface contextual information, and allows users to better understand issues. For example, Washington Post uses Apture to efficiently reveal Senator voting and disclose financial records. Apture is attempting to facilitate the exposure of public information hidden in hard-to-access formats. U.S. Congressional votes, financial records, and floor speeches are publically available, but tedious to access.  Using C-SPAN closed captioning data, Apture allows publishers such as the Washington Post to highlight debate, hand-select specific videos of House or Senate floor speeches, and even specify video start-times to pinpoint exact issues.  With health-care bills that are 1,000 pages long, such specific references become increasingly relevant and useful for anyone seeking fact over annecdote.

[kml_flashembed movie="http://www.youtube.com/v/VXqClB5tzn0" width="425" height="350" wmode="transparent" /]

As the Obama Administration and members of Congress attempt to reform the American health-care system, perhaps tools such as Apture can enable prominent media outlets and citizen journalists alike to surface relevant information with fluidity. In fact, last week Tech President aptly utilized Apture embeds to surface a White House memorandum from Peter Orzag at the Office of Management and Budget and John Holdren at the Science and Technology Office calling for greater use of technology to solve tomorrow’s problems.

Update: A reader corrects us; it is actually Washingtonpost.com that collects the data used by Apture in the Congressional voting record example above, which is available here. A great project.

The Cloud of War

As examined in “Orwell’s Google Search for Peace,” Google Internet search query data can provide useful insight. In observing the prevalence of proper nouns, such as electoral candidate names, linguistic variation is uncommon and need not be examined.  For example, interest in “Obama” around the world does not vary according to local language. Observing the online prevalence of nouns such as “war” and “peace,” linguistic nuance does help broaden the scope of the observation. Google Insights for Search allows for semantic nuance through the use of language, “+” or statements, and adding “-” negative queries to preclude similar, but unrelated, queries from slanting results.

Below, I focus on three Middle East geographies in particular, Iraq, Israel, and the Palestinian Territories, observing  the terms “war” and “peace” across three languages: Arabic, English, and Hebrew.   The “Fog of War” was once used to describe the level of ambiguity in situational awareness in battle.  Today, Google is allowing us to understand what should be known as the “Cloud of War” by observing conflict and reconciliation via online search interest.

IRAQ

"War" and "Peace" Arabic, English, and Hebrew Google Search Volume.

Iraqi Google Search Query Volume on Linguistic Variants of War & Peace.

Though search query data only goes back as far as 2004, and the initiation of the Iraq War came in March 2003, throughout the period of observation (from 2004-present) “war + מלחמה + الحرب” always outpaced “peace + שלום + سلام.” The largest spike in relative online traffic on linguistic variants of “war” came in October 2007.  A comparison with Google News volume during the same month indicates a corresponding expansion of press coverage.

ISRAEL

Israel Google Search Query Volume on Linguistic Variants of War & Peace.

Israel Google Search Query Volume on Linguistic Variants of War & Peace.*

In Israel, despite a history of fairly evenly distributed Internet search queries on Arabic, English, and Hebrew versions of “war” and “peace,” there is a spike in search on war terms coinciding with the Israeli January 3-18, 2009 invasion of Gaza. Israeli Google search on war reached its peak between January 4-10, 2009. What is noteworthy, however, is that Israeli queries on “war” subsided, and by the week of January 25-31 –only seven days after the January 18, 2009 troop withdrawal from Gaza– they were again commensurate with “peace” queries. What appears to be a blip in Israeli Internet focus is not quite so unpronounced in the Palestinian Territories.

PALESTINIAN TERRITORIES

Palestinian Google Search Query Data on Linguistic Variants of "War" and "Peace."

Palestinian Google Search Query Data on Linguistic Variants of War and Peace.

In the Palestinian Territories, Google search query traffic spiked on variants of the term “war” corresponding with the Israeli invasion of Gaza. Despite a history –since 2006– of commensurate “war” and “peace” search volume, the January 3-18, 2009 events had a lingering effect online.  Whereas Israeli query volume on “war” fell to levels of “peace” by January 25, Palestinian query volume on “war” failed to fully subside until June 23.

What reconciliation, online, had taken one week in Israel had taken six-months in the Palestinian Territories. As one additional data point for understanding mutual grievances across conflict zones, the “Cloud of War” is useful.

*Though Israel chart lists specific categories, “All Categories” selection was held constant across comparisons.

Orwell’s Google Search for Peace

The Global Peace Index (GPI), developed by the Institute for Economics and Peace in consultation with the Economist Intelligence Unit, measures the relative peacefulness of nations. Using both internal and external data across 24 indicators, from level of domestic violence to military expenditure, the GPI has been endorsed by policymakers and academics, from Kofi Annan and Jimmy Carter to Jeffrey Sachs.

Global Peace Index - Updated June 2, 2009
Global Peace Index – Updated June 2, 2009

The GPI measures the relative war and peace of nations. Internet search query data measures the extent to which people in given nations search for key terms, such as “war” and “peace.” War and Peace may be a Leo Tolstoy tome, but “War” and “Peace” online take on much more Orwellian form. While those nations deemed more “peaceful” in the GPI have a higher propensity to search for “war” on Google, less peaceful political states seem to more commonly seek online “peace.” The usual caveats apply, and conclusions drawn must consider the identity of the local Internet demographic, but the Orwellian dichotomy of War and Peace online is sufficiently provocative.

Online interest in “peace” is nationally greatest, as a proportion of domestic search volume, in Sub Saharan Africa. For example, Uganda, Lesotho, Ghana, Ethiopia, Kenya, Tanzania, and Zimbabwe have the highest domestic proportion of Google search volume on the term “peace.” Related keyword terms to qualitatively contextualize ancillary interest in the term “peace” include related “peace sign,” “peace and love,” and “world peace.”

In contrast, online interest in “war” is greatest within Western culture. For example, Western powers Australia, United States, United Kingdom, New Zealand, and Canada dominate in their domestic proportional Google search query volume on the term “war.” Related terms include “the war,” “world war,” and “civil war.” The term “Iraq war” does appear, but with 70 percent less volume than the Google query on “world war.”

GPI-determined "Peaceful" States Have Most Online Interest in War

States with a higher propensity to search on the term “war” ranked, on average, 58th out of the 144 nations tracked in the Global Peace Index. Though outliers such as the Philippines, Cambodia, and Lebanon did appear, New Zealand, Canada, Australia, and Singapore –arguably four of the top-25 most peaceful nations on Earth– had the greatest domestic search volume on the term “war.”  Perhaps such fascination with war underscores a desire to preserve peace. Though we’re 25 years past 1984, wasn’t this the purview of George Orwell’s Ministry of Peace?

States with a higher propensity to search on the term “peace” ranked 85th, meaning that according to the GPI these states were less stable, and more war-prone. While states such as Canada appear in both lists, high search volume on the term “peace” also came from far more unstable places such as Zimbabwe, Ethiopia, Kenya, and Uganda. While “peace” could be the search query of aid workers –just as one of the top search queries in Afghanistan is for “AKO” or U.S. Army WebMail– in secluded locations such as Zimbabwe this hypothesis is more problematic.

Top Google Search Query Volume Compared with GPI Rank

Looking at Google query data beyond English, and across linguistic divides, can also yield very interesting conclusions. For example, by comparing War (war+guerra+Krieg+guerre+война+戦争+战争+الحرب) and Peace (peace+paz+Frieden +paix+мир+平和+和平+سلام ) one observes that Latin American nations of Bolivia, Chile, Peru, Mexico, Puerto Rico, Dominican Republic, and Colombia have high search volume on “guerra.” Whereas there is focus on war in Latin America, there is broad focus on peace across the former Soviet Union.  For example, the highest relative volume of search on peace comes from the Russian Federation, Belarus, and Ukraine.

Despite Orwellian contrasts in GPI classification and online action, data across cities shows greater signs of hope. Worldwide, “peace” has greatest proportional volume in Washington, New York City, Chicago, Los Angeles, Toronto, Atlanta, San Francisco, Sydney, and London. While perhaps broad online interest in “war” permeates Western society, an online demos from regions with significant political and economic influence point to an online desire for “peace.” Perhaps the search queries of tomorrow won’t be in Newspeak afterall.