I Shall Overcome
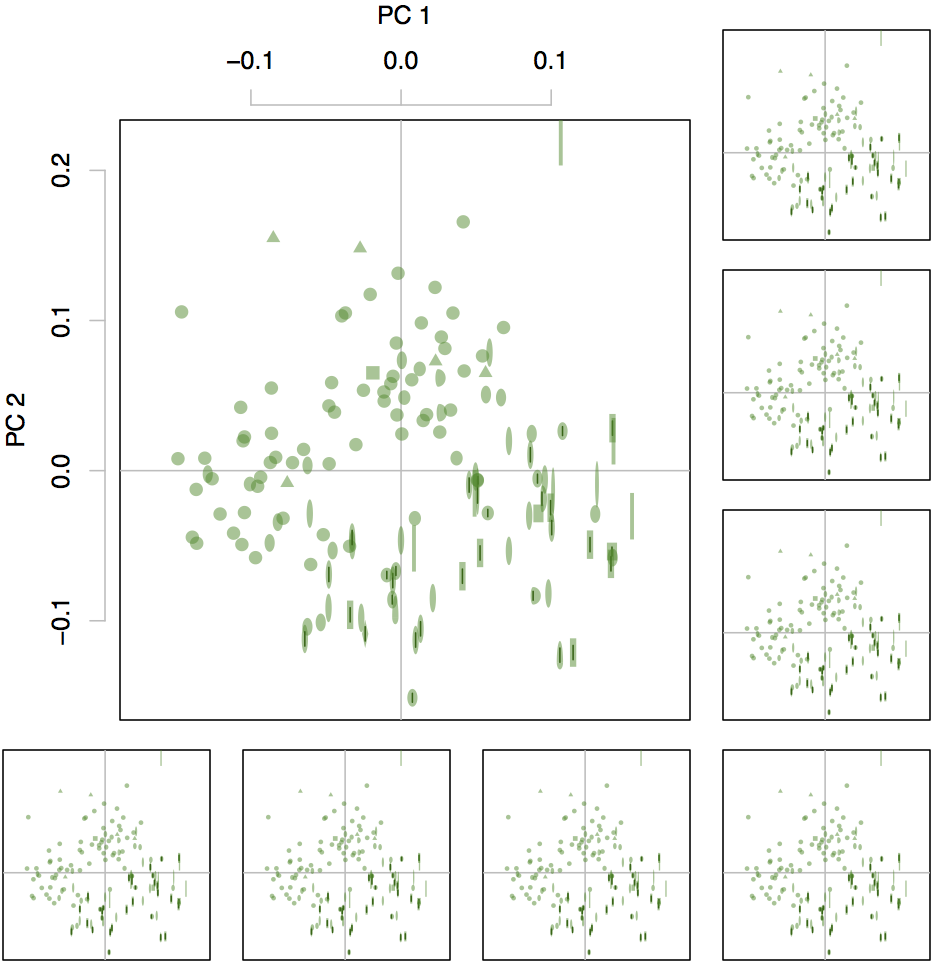
On my bus ride home yesterday, reeling from the day’s “adventures”, I realized a possible way forward for my Figure 1/character loadings problem. Begin with a plot showing the 2D or 2x2D morphospace. Talk about the difficulty with empirical morphospaces of not knowing what the axes mean. Explain something about smarter ways to visualize high-dimensional data using information coded into the appearance of each data point (as I have done). Then introduce the Foote way of retrospectively associating axes with characters using correlation. Describe Figure 1. Show that the characters that come out as most significant or associated aren’t the ones you’d expect. Explain why this might be because some characters have a lot of “n” states, and so are more likely to be strongly associated, and that some important characters have many states rather than binary, which makes it harder to be significantly correlated (if that’s true). Then show the characters that you know a priori to be important on the small PCO plots around the main PCO plot to give a better sense of what the axes mean. End up emphasizing that it’s better to use the whole morphospace wherever possible and to think of the PCO plots as what they are—a low-dimensional visualization of the real thing. Like making measurements on the animal rather than a photograph of the animal (or some better analogy).
On the road to accomplishing this, spent the rest of the day (at least the part not occupied by Phoebe’s practice talk for her Williams College interview) making that PCO figure. Hard. But fun, and rewarding. Learnt a lot more about placing multiple figures in a plot area. And finally cracked the conundrum of how to plot raphes (just use a line segment), and how to plot the oval forms (two half-ellipses with different y-radii or x-radii depending on how the ovals are flattened). Here my progress so far:
Huzzah. And just in time for bed. It’s 10pm, and I’m off for some well-deserved rest.
- previous:
- Rock Bottom, Already?
- next:
- Ladies and Gentlemen, Figure One


Beau
February 3, 2012 @ 4:37 am
Fantastic job – what a gorgeous plot! Would love to get you and the Google charts API together – wonders would ensue, I’m sure. Well done on making some serious lemonade out of the lemon-y situation; excited to see the first draft imminently…