Time for a Break
ø
Made this plot, following on from the plots showing average list length through time and average convex hull volume per list through time. It struck me that they looked similar, and indeed, when time is taken out of the equation and one is plotted against the other, it seems indeed that the major control on morphospace occupied by a list is the diversity of that list (at least when viewed on average per time bin).
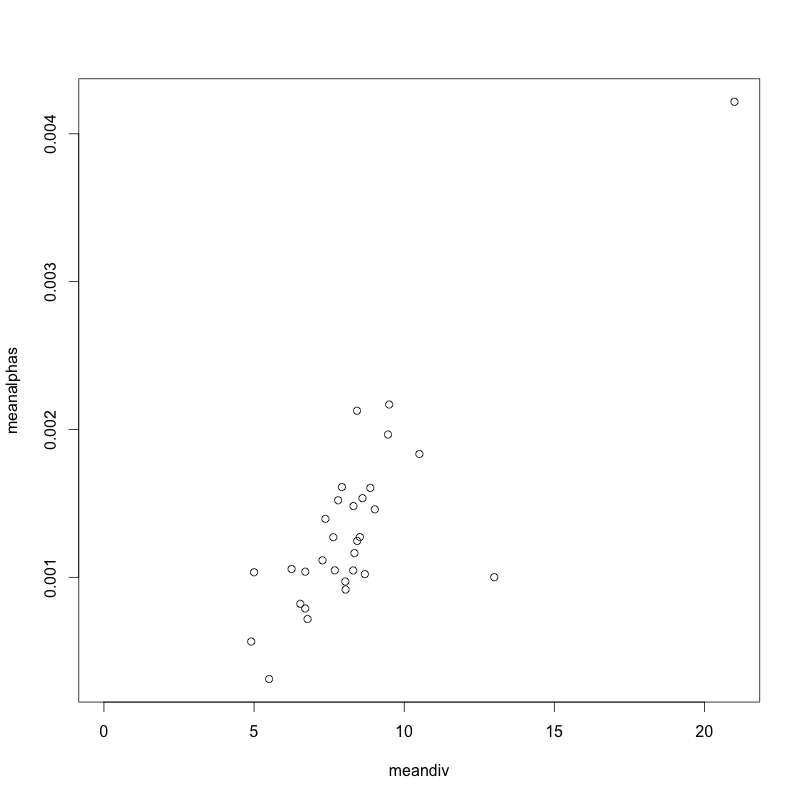
What does this mean? Well, in the most conservative (and perhaps cynical) interpretation, I would read this to mean that morphospace is pretty well constant over time. Some lists are longer than others, perhaps because of the choice of what taxa to list for a particular section, or perhaps because there were simply fewer taxa present in the section. But the more taxa are found, the more morphospace is occupied. The two outliers are, of course, the Cretaceous samples (data collected according to very different rules), the rest fall on a pretty tight trendline.

