Back from Denmark; Index Cards, Last Plots
ø
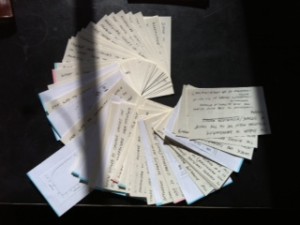
It’s been a slow trickle coming back from Denmark. I have been writing a bit more in my document (see the results here), but then decided that a better way to go was to write topic sentences for paragraphs/main points out onto index cards to be subsequently arranged into a logical order, the first attempts at which I have also been sketching out (in an actual notebook, with an actual pencil).
This afternoon I finally bit the bullet, booted up R, and started the final couple of analyses and plots. I think I’d been holding onto them as a last resort of “I know what I’m doing” type of tasks before the truly gaping maw of writeup uncertainty. That last resort is now dwindling. Here is the plot for the number of realized character states, including a panel standardized by the number of genera in each time bin:
The number of realized states goes up, unsurprisingly. This agrees with the PCO volume metrics (convex hull/alpha shape volume). When divided by the number of genera, though, the realized states go down—meaning each genus contributes less “raw” morphospace individually as time goes on. This I think reflects the same thing as the mean pairwise distance plot, which also goes down through time (at least a bit)—more and more taxa are being packed into the occupied volume of morphospace, and it’s happening more quickly than the expansion of morphospace itself.
One of the remaining plots I had on my list to do was the “number of realized pairwise character combinations” through time, mostly because I had read it used in a few different places (including the review by Ciampiglio, the review by Erwin, and at least one of the Foote papers), but I had not understood what it meant. I spent some time yesterday reading about it, and I think I get it now. But I am not sure if I want to bother to do it.
Here’s my best stab at explaining what the “realized pairwise character combinations” are. First, it helps to think about what a morphospace of discrete characters looks like, or at least can be thought of. Let’s start in lower dimensions. In 2D, we can think of a morphospace with just two characters, say color (red, green, or blue) and outline (square, circle, or triangle). This could look like a 2D grid, or matrix, where each square can be occupied or unoccupied by an organism.
- Red Green Blue
Square X X
Circle X
Triangle X
In this example, we have red and blue squares, but no green squares, blue triangles but no red circles, and so on. Now we have two characters with three states each, and six character states in total. But there are nine possible pairwise character combinations. Let’s add another character. If we add limbs to this—with states one or two—we get an additional dimension, or two “layers” of these nine combinations for a total of eighteen possible configurations of organisms. The more dimensions (characters) we add, the more sparsely occupied the morphospace will be for any given number of organisms. For example, in our 2D space we could realize all possible morphologies with 9 organisms, if they were all different; for the 3D space we would need 18. Add another character with four states, say, and now we need 72… so as you can see for a large space such as mine, the number of possible combinations becomes huge.
In my case, I’m not sure what it is exactly, but assuming an average of 3 states per character and 123 characters, that’s 3^123, or 5 x 10^58. That’s somewhere between the estimated number of stars (10^23) and the number of atoms (10^80) in the universe. So, with about 140 taxa, a very sparsely populated space. So comparing how the space in its full dimensionality fills up through time doesn’t make much sense—it’s going to go from being basically empty to being basically empty.
So what to do?
What I’ve done in the graphs above is to collapse that hyperdimensional space into just one dimension—think of it as a linear row of boxes, each box representing a character state, either filled or unfilled. How many boxes are filled through time? For the toy example above, it would look something like this:
Red Green Blue Square Circle Triangle One limb Two limbs
X X X X X X X
Clearly, this is an easier space to fill! In the toy example, I’ve assumed there are no two-limbed things, only one-limbed things… In any case, that’s the idea for the plots I posted above. Now, here comes the conceptual jump for the pairwise character combinations!
- previous:
- Time for a Break
- next:
- Pairwise Combinations, Continued


