You are viewing a read-only archive of the Blogs.Harvard network. Learn more.

Progress Report Time (This Time, Without Giving a Shit)

ø

Progress report season… for the sixth time! Yay! Well, actually I’m not sure I even had a progress report the first two years, but whatever. I spent yesterday evening reading through the past year’s DSA notes (depressing), comparing them to the goals I set out at this time last year (actually, precisely to the day!). This morning, I sat down and wrote out the progress report and handed it to Andy. I was feeling pretty good about myself, particularly since I managed to convince him not to call a committee meeting (for the first time ever). But then he read over the report and came back to my office to request a change: I had described how, as per his recommendation, I was dropping the diatom diversity project and instead expanding the morphospace project to two chapters, he “reminded” me of the PlanktonTech book chapter we agreed to write and asked that I change the section in my progress report back to include a chapter on diatom diversity.

What?! I thought the diatom diversity chapter was dead. I thought I had explained to Andy that I didn’t think the SQ subsampling method was going to work on the Neptune data. I thought he had suggested I drop the chapter, “with an eye toward finishing sooner rather than later”. Well, that didn’t seem to matter much—I suppose he remembered that there was a book chapter due for the PlanktonTech people, and that it was supposed to be about diatom diversity, and that was it. Just add it to the dissertation, as another chapter.

I could freak out at this point. I could despair about how to goalposts keep shifting. I could sit down and try to realistically plan how I am going to go from two chapters worth of data and analysis and no chapters written to four chapters worth of data and analysis and four chapters written by September 15th (the deadline for dissertation submission for the November graduation date). But I think I’m just too exhausted to do that at this point. Andy wants a chapter on diversity? Fine. So I rewrite the progress report (here it is, by the way) to include a few sentences about how “the diatom diversity project will take on a smaller role and will be represented by a short review chapter for submission to the book resulting from the PlanktonTech research initiative”.

Whatever. I don’t have the energy to engage with stressing out about how long things are going to take, when I am going to be done, what the dissertation is going to look like. The best I can do right now is go from one day to the next. Today, I needed to get a progress report done and signed by my committee members. I did that—I got Andy, Jacques, and Dave to sign off on it (and without requiring a committee meeting!). Whatever happens tomorrow, or next month, or when the thesis is due, happens then. Who cares what the damn report says.

Reading, Thinking About Diatoms

ø

Andy laid out a possible division for the two chapters in our meeting yesterday, when I pushed him to do so (being completely stuck myself as to where that division should fall). He grouped the description of the morphospace, the loadings, what the axes mean, comparison to NMDS, comparison to the phylogeny, and correlation with genetic distance into one paper, then the disparity and diversity measures through time and various subsampling approaches into another. He suggested using the stacked space-through-time plot as the culmination of the first paper, though I’m now wondering whether it wouldn’t make more sense to use that in the second paper, if the theme of the first is morphospace and phylogeny and the theme of the second is morphospace and diversity or morphospace through time. I think it is gong to be key to figure out exactly what the theme of each paper is. I don’t know right now, that’s for sure.

In any case, before next week I will need to finish up the last plots and analysis, which includes picking a few characters or groups of characters relevant to biological hyptotheses about what might be going on in the morphospace through time. In order to approach this, I need to read, so that’s what’s on the docket for today. Read about diatom evolution, and take notes about what sorts of characters I might use to test the ideas that are out there.

A couple of thoughts that occur regarding what the real diversity/morphospace history might be: we know that the range-through diversity and morphospace history provides a true minimum estimate. Everything we observe we know was there—the difficulty is knowing how much more there was. From that perspective, of course, it’s silly to subsample anything, since we are throwing out data to generate curves with less diversity and fewer observations when we already know that in reality there was more. But, since we don’t know how much more, we subsample and standardize in order to compare like and like to see relative changes. We never want to read anything into the axis labels on a subsampled curve. So what the subsampled morphospace curve tells us is that we have to consider the possibility that sampling bias is part of what generates the picture we see when we look at the raw or ranged-through pattern. It doesn’t say that the true picture is the subsampled picture.

Perhaps one of the things we can look at is disparity and diversity per site? Like we have alpha and beta diversity, can we have alpha and beta disparity?

Another thought—can the biomarker record help us here at all? If preservation really is the enemy, and there were are lot more diatoms around and we’re just not capturing them due to our poor sampling, perhaps we can see supporting evidence from molecular fossils? The Sinninghe-Damste paper on C25-HBI biomarkers for rhizosolenoid diatoms suggests they were around, and abundant, by about 90 mya. How does that compare with the occurrences of rhizosolenia taxa in the Neptune database?

The Diversity Chapter Is Dead. Long Live the Thesis!

ø

Had a meeting with Andy this morning—I had wanted to show him my disparity-diversity plots, particularly with the different story told by subsampling, and show him the interesting result from the SQS Good’s U values (being counterintuitively high through time, suggesting a major problem for the approach). The upshot was that Andy now definitely recommended splitting the paper into two parts (“everything you have plotted here should be a figure in a publication, but it’s too much to fit into one paper”), and—more importantly—that as two chapters, together with the radiolarian lineage project, would constitute a thesis.

I had to ask explicitly to confirm, though it was already clear by implication, whether this meant that I didn’t need to do the diversity project to graduate. “Yes, exactly,” he replied. Woot, woot, woot! One less project to do. Not necessarily the one I would have chosen to drop, but whatever. It’s one entire project less to do before I can leave this entire episode behind me. Hallelujah.

I spent a good while bathing in the glory of that news, and checking in with the new iPad being unveiled, then moved on to printing out thumbnails of my figures and pasting them onto index cards so I could work on how they would be arranged in these two new papers. It’s going to be a big challenge for me to figure out what the division between the two should be, and what the two narratives for the papers will be, but at least I now know that’s what I need to do.

March Madness, Day 2

ø

Gave Kati a ride to work and planted myself in the shiny new law school building in the morning. I had written a note to myself last night when I stopped working (at about 10:30, a March-madness-worthy hour) with three tasks for the start of my next day, but of course I forgot to bring that in the rush of the morning. Perhaps I can remember:

  1. Fix the genus richness plot to remove bins with zero diversity (replace with NA).
  2. Implement the species-level diversity calculation for UW.
  3. Add code to the genus-level morphospace subsampling to keep track of genus diversity.

Following this list, I pretty much nailed the morphospace subsampling exercise this morning, with only moments to spare before my battery failed at the law school and I migrated to the office. The subsampling takes a while to run, perhaps long enough to warrant running it on the cluster. 100 iterations of the morphospace subsampling and 200 iterations of the species diversity run for a couple of minutes. To get a really reasonable result I guess I should probably run it for, on the order of, 10,000 iterations. So that would be a hundred times a couple of minutes, in other words, on the order of hours. Even 1000 minutes is just 18 hours, which is just fine by me in terms of computing time on my laptop, I can just have it running while I sleep.

I really should, however, plot error bars on my subsampled data to give a sense for the range of variation in subsamples. Spent some time wondering about what a 95% confidence interval meant for these things until Tinker explained that it was literally just the range in which 95% of the subsamples fall, which is so obvious it’s embarrassing I even had to ask. Anyway, that makes it fairly easy to plot the error bars, I think. Well, so I thought. It ended up taking up the rest of the afternoon until 4:15 to come up with this, although it finally is a plot of my diversity/disparity measures as calculated for UW subsamples (100 morphospace, 200 species diversity replicates):

Now, alas, I have to stop—I promised the museum I would volunteer at tomorrow’s paleo fest and I need to spend the rest of the hour before set-up starts reviewing my paleobotany notes so that I’m not completely and utterly unprepared when it comes to talking about the plant fossils I’ll be standing behind. All in all, a busy and successful day. One more plot out of the way (I think—I could try and make confidence intervals for the other two panels, but it’s been so much damn work I’m not going to do it unless someone forces me to).

Shareholder Quorum

ø

Another weekend away from work, and no, it doesn’t feel great. Somehow it just happened. Fuck.

Anyway. I’m trying to figure out how to implement Alroy’s SQ algorithm. On Friday, I couldn’t get his website to work (where he had posted the R code), but he replied on Saturday with the fixed link, and so I’m now sitting (at Darwin’s again) reading through his code and trying to understand how it works. I wish I could see it in action with an example data set, because I’m not entirely sure what sort of data the function actually takes (while his documentation is much better than the code junk I got from Rabosky, it still leaves much to be desired). Is it just counts of taxon occurrences? If so, i.e. if the function doesn’t identify what particular taxa are in the subsample, this is going to make the proposed exercise of subsampling the morphospace very difficult indeed. Well. It’ll require rewriting the function.

From a little bit more reading and some monkeying around with the code (i.e. loading the function in R and passing some sample data to it), I find my suspicion supported—it seems as though the function simply takes an array of numbers representing the occurrence counts of different taxa in a time bin, plus the other function parameters, and returns the average number of taxa in the appropriate sized subsample (over the requested number of trials or iterations). This does make calculating the diversity curve fairly easy, but makes it that much harder to get the morphospace to subsample.

Should I just rewrite the function for my own purposes? It doesn’t seem all that complicated, really… Aargh! I am unmoored. I don’t know what to do nor what I’m doing.  The approach I was taking in constructing my own SQS function back in the day was quite a bit different, passing the full database back and forth between functions; Alroy’s approach of just passing an array of counts seems much more efficient, probably uses way less memory and is consequently faster? Although I do lose the ability to track actual taxon names. Maybe a combination of the two would be the way to do it—instead of the full database, have the function operate on a list of names?

Started by calculating Good’s U (by the original, simple formulation) for 2-myr time bins. There is very little variation in coverage estimated in this way. Correcting for this is going to do nothing for the diversity curve:

This is kind of an important plot, because it shows that implementing the SQS, at least in the simplest way, isn’t going to do anything to correct the diatom diversity curve from Neptune. I think I know why that is, too. Good’s U is measuring how well the standing diversity of a time interval is captured in the fossil record by looking for how many singletons there are, i.e. how many taxa only show up once. The greater the proportion of singletons, the more likely you’re still missing a lot of the standing diversity. Here’s the big but, though: basically all of the Neptune data is collected in m*n taxonomic charts where the m rows represent m slides prepared from borehole samples at m depth intervals, which the poor shipboard paleontologist scans through to check for the presence/absence or abundance of n different taxa. [This is the model of data collection that Dave Lazarus talks about in that recently published paper I reviewed for him at such great length last year.] This method makes it very unlikely to have singletons. I think that’s why the Good’s U values are all so high in the plot above.

The numbers would probably go down a bit if Alroy’s correction for dominant taxa were applied—i.e., take out the most abundant species, but that doesn’t really address the problem of the data collection method being strongly biased against singletons.

What if there were another method to estimate coverage, not as vulnerable as Good’s U to the bias from the Neptune-esque method of data collection? What would that look like? I suppose it could look at how many taxa show up in only one borehole, since that’s sort of the equivalent of an ‘occurrence’ of a macrofossil taxon in PBDB. That would probably work quite well for the most recent time bins, where there are dozens of boreholes, but most of the Paleogene time bins have only a couple of boreholes at most, and so many would have a very, very low coverage by that measure (I think). It might be worth a try, I suppose.

Grrr. This is not helping me make progress with the morphospace. I feel like I’m disappearing down a rabbit hole of distractions and unforeseen complications again. What I need is to get this paper done. I need to get my figures together, so that I can get the chapter written. So that I can move on. This is what I need to keep my mind focused on. I thought it would be straightforward to add diversity subsampling to the analysis of morphospace, but maybe it’s just too difficult. Maybe there are just too many complications with implementing SQ subsampling for this sort of data to apply it “straight out of the box”, as had been the plan all along. Well, fuck.

Maybe I just need to refocus on something else for a little while to let the frustration subside, because I’m pretty well boiling with frustration and rage right now. I also need to re-run the stacked 3D morphospace plot for my new cull of data so that I can plop that into my LaTeX document. Might be just the thing to do right now.

Back at the Office: (Helpful?) Interruptions

1

Back at the office. Started the day where I left off yesterday—getting the diversity panel for the disparity/diversity figure together. I had plotted genus and species richness on the same scale, but that really didn’t look great (the genus diversity was basically flatlining), so I think I’ll overplot them on the same frame but at different scales.

I was interrupted by a visit from Tinker, shortly thereafter joined by JC. It was nice to see them (and it had been several days since I talked with either one), but it definitely contributed not insubstantially to the loss of a morning’s productivity (it’s lunch time now, and I’m still only getting started). Clearly, I get more done at a café (ideally one with expensive, non-functioning wireless) than at the office.

That said, the conversation with Tinker and JC was quite helpful—I was talking through my latest plot and Tinker pointed out that, perhaps, my mean-pairwise-distance plot was flatlining because it considers all of the characters, not just the ones with the most variance—which by definition is what should be captured by the first few PCO axes, on which the other measures (convex hull, alpha volume) are based. The test, it occurred to me on thinking this through, would be to plot the mean pairwise distance through time as measured in the space defined by the first 3 PCO axes. If that also shows an increase, then it’s the confounding non-variable characters in the original d-matrix causing the flatness; if the plot however is also flat, then there’s something to be explained.

In any case, I eventually got some reasonably focused time in, though only a fraction of what I achieved yesterday, and finished the four-panel diversity/disparity plot:

It was very gratifying to hear both JC and Tinker ooh and aah over it when they saw it; JC also mentioned that Andy had come by to chat to her and asked, very excitedly, whether she’d seen my plots and how good they looked. And it was loud enough that Tinker heard it, too.

What I would really like to do now—with a view to the insight that struck me at Diesel yesterday—is to set up the code for this figure so that I can generate different versions of it based on different taxon (sub-)sampling algorithms: sampled in-bin, range-through, boundary-crossing (?), naive rarefaction, by-list unweighted subsampling, and of course shareholder quorum subsampling.

Here, incidentally, is the pairwise distance plot through time using Euclidean distance in PCO space (first three axes only)—showing that disparity is pretty constant through time, by this measure, and it’s not an artifact of using the whole data vs. just part of it.

This is a pretty interesting result I’m going to have to think about (probably best to do that by writing). And need to dig up that Erwin paper… Anyway. Time to go home!

Diatom Diversity Detour

ø

After another write-off of a day yesterday—felt utterly exhausted and tired, and eventually just left to go home and get my mind off of everything—I have a meeting lined up with Sergio Vallina (a postdoc at MIT) and Pedro Cermeño (apparently a professor in Spain somewhere, joining via Skype) to talk about diatom diversity. These are the guys who, as Zoe told me earlier this fall, are about to publish their work on diatom diversity. This had sent me into a bit of a tizzy at the time, believing that this might threaten the feasibility of my second chapter, but I suppose it’s better to know what they’re doing and learn what I can do differently, than cry about how I’m being scooped.

So, it having been several months since I’ve so much as thought about diatom diversity (or longer? I don’t even remember), I felt that it was time to recap my findings so far before the meeting. Spent a fair bit of time printing out old emails, reports to Andy, and my reviews of Dave’s manuscripts. It’s remarkable how much time I’ve actually spent thinking about this stuff (pretty deeply at times) without actually getting anything produced from it. All this gestation must lead to some pretty spectacular (though maybe bloody) birthing event at some point.


Slumpage, Recoverage, Moving-On-age (Yes, It Happens)

ø

It’s been a tough week-and-a-bit. Not wasted, as Beau convinced me in our DSA chat last week, because these experiences are all a part of the “normal emotional cycle in a very challenging work environment” (in quotes since I couldn’t possibly have said it better myself), but a hiatus in the substantial forward progress I’d been making over the past few months nonetheless. In any case, I’ve finally—finally!—trumpets, sunbeams, angel chorus—sent off my annual report to PlanktonTech, the presentation for their April meeting, and my ceci-n’est-pas-un-review of Dave’s diatom diversity manuscript. The relief of finally having that stuff off my desk, even if it’s a little late getting out, is palpable.


I’m Sorry Dave, I Can’t Do That

1

Although that’s kind of what I felt like telling him, unlike HAL-9000, I do still need Dave. So I finally buckled down this morning to step through the rest of his manuscript, hunting down typos and noting what constructive things I can say about each section.

I had left off the last time at the section “Preservation at the species level”. In his table of % preservation of extant species, he gives diatoms only a <50% percent score, but gives the total extant diversity as 1,500. While I have no doubt that there are at least that many diatom species today, I’m not convinced that there are anywhere near that many that are commonly found as pelagic, planktonic species. Much of the extant diatom diversity (which far exceeds 1,500) is terrestrial/lacustrine or benthic/epiphytic marine, and is sampled in the Souria survey as tychoplankton. I chased up the Souria, 1991 species to see where that number comes from. Indeed, between 37 and 44% (depending on whether you choose the low or high end of their range estimate) of the diatom diversity reported consists of pennates—which are mostly benthic. I think if you were to include only those species that are, like radiolarians, exclusively marine and planktonic, the % of preservation would be far higher. It would also be nice to have the number of preserved fossil species in the table (not just the %age), and a source reference for that number, cited in the table legend. Well, I just checked the Kooistra chapter in Falkowski & Knoll, and he cites numbers between 5,000 and 10,000 for the diversity of strictly marine planktonic diatoms. Oops. Well, scratch that, then.

Much of the rest of the section is OK, although there’s a paragraph on page 7 I have a bit of a hard time with. I don’t think I’ll comment on it, but Dave makes the point that even though preservation is so good, it’s possible that there were times when very ill-preservable species of radiolarians evolved, that left no record. Sure, it’s possible, but so what—it’s also possible that the Earth was invaded time and again over its history by purple alien cloud-people who left no footprints and no traces of their influence. Sure, it’s possible.

He also makes the point that there are ‘significant gaps’ because some regions, such as the gyres, don’t leave much of a microfossil record at all. This is true, but again it seems like peanuts compared with the sort of comparatively appalling preservation characteristic of invertebrate fossils on the shelves.

When Dave talks about hiatuses, again, he makes the deep sea record seem worse in comparison to the shelf record, in a way I’m not sure is fair—because he suggests there are no changes in lithology to suggest a hiatus has taken place. My sense is that changes in lithology don’t necessarily help you in shelf sections—sometimes they might represent very little time, and sometimes there can be consistent lithology over many millions of years. I’m not sure the problems of recognizing the partitioning of time in rocks are really meaningfully different in deep and shallow sediments.

Fortunately Dave ends the section on quite a positive note; perhaps I didn’t quite appreciate this on first reading. He says that in spite of all of this, the record is really good—species level evolution for entire clades for most of the biogeographic provinces over the past 100 million years.

Unfortunately, he then launches into a diatribe about how poorly this record is recovered and documented. This is the next section, “Recovery of Deep-sea Fossil Material”. This section begins with a description of piston-coring, and its fantastic coverage, but the admittedly damning limitation of short timescale. Moving on to deep-sea drilling material, he duly acknowledges the staggering number of fossils already available for study (at least 10^15 specimens, a million times more than all the world’s natural history museums combined), and the fact that most of these come with coeval paleoenvironmental data. Surprisingly (for me, given what I remembered from my first reading of the paper) he also ends this section on a positive note, namely that the record is nearly complete at the species level, given that the MRC holds more than 100 samples per million years for most of the Cenozoic.

In the next section, “IRAT—Imperfections in the Existing Dataset”, he explains why the data generated from these samples is less than complete, and why it’s a problem to use them for paleobio research. “Incomplete Data” outlines a problem with how species are recorded on a slide. Rather than the ideal model, in which the paleontologist records the taxonomic identity of a certain number of specimens, and then moves on to the next slide, thereby obtaining a random and unbiased subsample of the sample in hand, the situation is usually as follows. The paleontologist has a list of taxa that is as short as it can usefully be, and he records presence/absence (or abundance) of those taxa in order to determine the age of the sample.

But on top of this, the paleontologist often records some additional taxa, which do conform to the random sampling. Crucially, he states that “the differences in the average reported diversity per sample/study simply reflect the average practical size of a taxonomic list, and do not have a necessary relationship to actual real sample diversity”. Now this seems to be the key sentence. Does this mean each study has a different taxonomic list, and that’s what determines list length, more so than underlying diversity? If so, this should be easy to test (and I think Dave should do this if he wants to back up his argument): what publication a sample is from should be a better predictor of list length than what time it’s from. So, if the Neptune database has publication information (which I hope it does), you should be able to parse the data by time bins vs. by publication, and see if the variability is better described by what time bin samples are in, or by what publication they’re from. This could be compared by Akaike weights, for example.

The next paragraph—on page 11—is really quite confusing, and stands at the heart of the part of this paper that affects what I’ve been thinking about and doing with diatom diversity. Dave states that most data is collected by his “model C”, so the model where paleontologists record the presence/absence of taxa on a list, plus whatever other taxa they fancy. He states that this leads to a correlation between sample availability and total diversity, but not because of the reason we might think (i.e., going up a collector curve)—but rather, because sample availability is correlated with taxonomic effort. I think what he means here is that sections with more samples available have “model B” taxonomic lists that are longer than sections with few samples. It seems to me, though, that this reduces down to the same thing as collector curves, albeit via the detour of constructing a list: the more diverse-seeming assemblages seem thus because they have longer “model B” taxonomic lists, not because they’ve had more random samples taken, but the reason they have longer taxonomic lists is because there is more “sample availability”, as Dave puts it, which I think means… they have been more extensively—randomly—sampled.

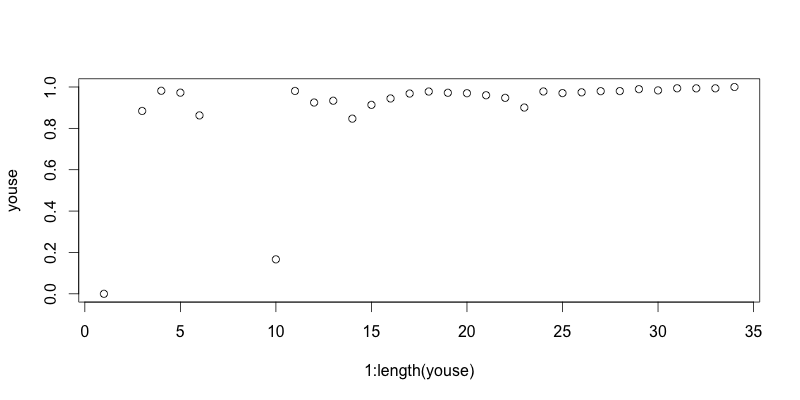
In the next paragraph, he rallies support from a figure (figure 8) that I just don’t understand. The point he’s trying to make is that species are more rarely reported than they should be, I think; what he shows is a histogram of the number of samples from which a radiolarian taxon is reported; 100+ taxa show up in only 1-5 samples, and 40+% of taxa show up in 25 samples or fewer. Besides the fact that the plot is confusing (not clear what the inset plot is, vs. the main plot, nor what the total number of samples is) and the calculation in the figure caption is impossible to follow, I’m not sure this addresses the same point as the preceding paragraph. That paragraph was trying to say that subsampling exercises wouldn’t work because many, or most, of the taxa in the database will be from “model B” lists of stratigraphic marker species. Apart from the fact that this might not be true (see below), the point explored with figure 8 is different.

Is it true that “model C” makes subsampling impossible? I think Dave might have his answer backwards, actually. If the “model B” list is consistent over time (and I’m not sure what Dave’s stance is on that—he seems to want it both ways at the beginning of this section), then you might actually be making a much fairer comparison if you are subsampling by lists, because each list you pull will be comparing apples to apples in its “model B” component. In addition it provides its “model A” component, but that should be subject to the same qualifying properties of random sampling as sanctioned by Dave in the beginning of the section, so it should behave well under subsampling. So, aren’t we actually improving things in this way?

Of course, if lists are different depending on what time interval we’re looking at, then I think the “model C” argument just breaks down to a “model A” scenario, more or less.

The main point here, though, is that this does not distinguish the microfossil record in any way from the rest of the fossil record—dominated by shelf invertebrates—as recorded in PBDB. That record is also a combination of biostratigraphic occurrence data of a limited, and commonly represented, stratigraphically informative species, and a more or less random sampling of other taxa. How does that make the microfossil any worse?

Moving on, the section “Reworking” opens with the claim that reworking affects only the microfossil record, a claim I think can hardly be considered true. I don’t have any great references at hand, but can offer one (sight unseen, thanks to a lapsed subscription to Lethaia, cheers Harvard): Fürsich, F.T. 1978. The influence of faunal condensation and mixing on the preservation of fossil benthic communities. Lethaia, Volume 11, Issue 3, pages 243–250. Also Kidwell, S.M., 1998, Time-averaging in the marine fossil record: overview of strategies and uncertainties: Geobios, v. 30, p. 977– 995. Kidwell, S.M., and Bosence, D.W.J., 1991, Taphonomy and time averaging of marine shelly faunas: in Allison, P.A., and Briggs, D.E.G., eds., Taphonomy: Releasing the Data Locked in the Fossil Record: Plenum Press, New York, p. 115–209. Recent study: DeFrancesco, C. and Hassan, G.S. 2008. PALAIOS; v. 23; no. 1; p. 14-23.

And again, these issues are all the same issues that befall the macrofossil record, too—I don’t think an obviously reworked specimen will be reported by a trilobite worker as occurring in the formation in which it was found.

The first sentence of the “Age Model Problems” sentence really says it all—they’re way better for the marine microfossil record than for any other record we have. And that should be the focus of the paper, not all the things that are wrong with it! In diversity studies, a 1-my error is not a problem if we use 2-my bins. Also, this error is unbiased—and this is a critical point—so for macroevolutionary studies, it really shouldn’t matter. As long as it affects everything equally, and more or less evenly throughout time, we should be golden as long as the signal we’re trying to see is strong enough.

The same “but it’s even worse in the rest of the fossil record” argument can be brought against the “Taxonomy” section, which says because there’s convergence and some morphospecies overlap through time, but this has got to be a pretty minor problem and should only cause ranges to extend very slightly.

“Reworking, Age Model Errors and Macroevolutionary Metrics”. Dave shows his calculations (or their result) that suggest 5% of radiolarian LADs in Neptune are off, and 3% of FADs. He adds it up to a total error of 8% of all occurrences being outside the true range of the species. This leaves the apparent ranges of many taxa extended beyond their true ranges, which is a big difference to most of the rest of paleontology, where the opposite is the case (this is actually a really good point, I think). But because taxa are rare, Dave proposes using range-through; the problem then becomes the artificial range extension and how to deal with it.

I think it might be worth piping up here and putting in a word for Alroy and his distaste for range-through, because of the ugly edge effects it causes. But to illustrate the downfalls of range-through, Dave does something really sketchy here that bothers me a lot. He takes a 1 my time bin for forams in Neptune, and compares what’s found there to what’s supposed to be there based on the biostratigraphic framework.

Monkeying with the Three-Timer Statistic

ø

In spite of my heroic efforts—dragging myself to work on labor day, an achievement that required forsaking a morsel of  socialist integrity—my attempts at setting up another overnight run of the FIB were thwarted by a “suppressor below limit” warning, which made obtaining any sort FIB image an impossibility. Thereby rendering the whole exercise impossible from the get-go. The upside was that I regained my labor day, the downside that I have nothing new to report from the FIB.

This morning I bit the bullet and finally replied to Dave’s email, meanwhile a week old, apologizing profusely for any offense I may have caused in my request of the full Neptune database, and proffering up my effusive thanks for the file he did provide. I’ll discuss the situation with Andy in our next meeting (perhaps Friday?) and see what he says, besides of course trying to decipher whatever runes constitute Dave’s reply.

I decided to return to Friday’s question of the three-timer statistic, which turned out so differently than I had expected. Did I do something wrong with it? I thought I might compare my curve to what’s in the Rabosky paper, but in his supplements, the only thing he shows is the sampling probability for each of the subsampling exercises (rather than the overall sampling probability, as I have calculated, for the raw data).

If I didn’t do anything wrong, then the huge differences between the curves in my three-timer graph and the SIB/RT graph must lie in one- and two-timers, which I think is the only difference between the two counts. However, this difference would inflate the total diversity considered in SIB/RT and make the relative difference (between SIB and RT, analogous to the difference between 3T and 3T+PT) smaller… so, at the end of the day, the SIB/RT ratio should be higher than the 3T/(3T+PT) ratio. Which it isn’t! It’s lower, and a lot more variable. That variability I don’t think I can attribute to one- and two-timers, because any addition of those entities to the SIB count will also show up in the RT count, and vice versa.

Perhaps the way to tackle the question of whether the algorithm is actually doing what it’s supposed to do, I’m best off doing what I did with the SIB/RT algorithm: make sure the 3T and PT are being calculated properly by adding lines to the function to return those values along with the final %age. Did this, and couldn’t find much of anything out of the ordinary that would suggest something was going horridly wrong. The only low %ages are in time bins 47 and 48 (32% and 3%, respectively), everything else is above 70%. Unlike in the SIB/RT calculation. Here’s another view of the graph (same as last post’s), but with the x-axis expanded:

Don’t know what to do beyond this. It is what it is, report to Andy, move on? One final thing I could do, I suppose, is correct for the edge effects by comparing the focal bin to the adjacent time bins only, rather than comparing to everything before and everything after. Here’s the outcome (not much different, as is plainly clear):

Again, “preservation” (or “sampling probability”, as I think Alroy calls it) is pretty steady at between 95-100%, with some dips in the Eocene, and a little one in the early Miocene (which doesn’t show up in the long-range three-timer plot above, presumably because the missing taxa in the bins adjacent to the ~22 Ma time bin with the low %age are present elsewhere in the data set, from whence they can be ranged through).

The siren howled a little earlier this afternoon, in recognition of Beaudry’s imminent departure. It’ll be a tough start to the working day tomorrow knowing my DSA buddy is an ocean away. For today, I’m calling it quits.