You are viewing a read-only archive of the Blogs.Harvard network. Learn more.

March Madness Day 19: No Energy

ø

Motivation is at a new low. I just can’t seem to summon the energy to do any work. I am just dispirited.

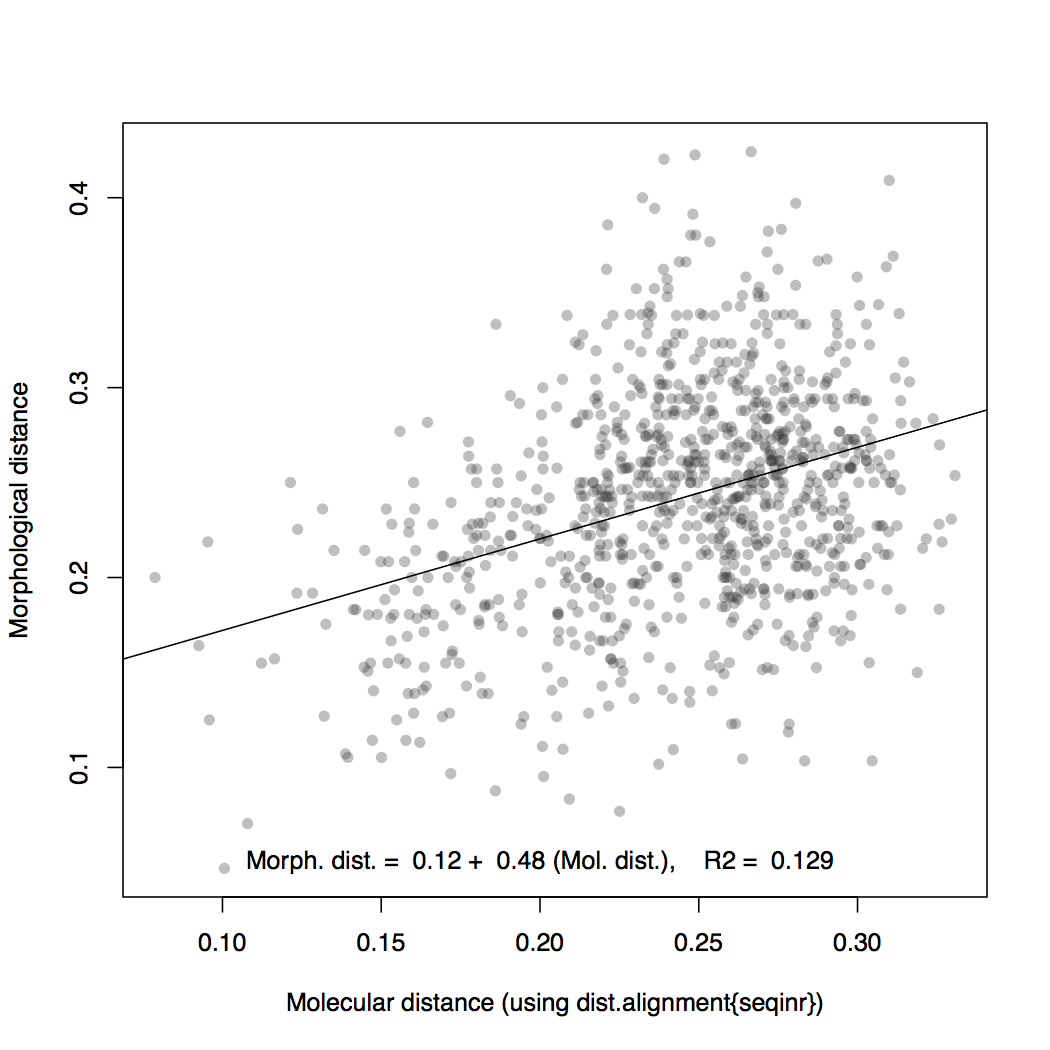
It took me a long time to get going, once again, and I spent the morning catching up on DSA posts for last week. Scott Edwards got back to me by email and I tracked him down in the afternoon for a chat about molecular vs. morphological distances. He was incredibly nice—just a really friendly guy—and I did get one or two references out of him. But in general I found it quite hard to get much out of him that was directly helpful. What I had been hoping for was context and explanation of the plots I’d made, basically a sense of what that distance comparison would look like for other groups of organisms, and whether my plot is expected or unexpected. Instead, I found that he seemed most interested in advising me to do other analyses with the data I have—mainly studying the evolution of characters on the tree, relating morphological change to speciation events, for example, seeing if disparity grows anagenetically or cladogenetically, and so forth. These are of course really interesting questions, but they’re a lot of extra work and analysis that I don’t think I have to the time to do. There just seemed to be an almost unbridgeable gulf between my approach (focused on morphology alone, making comparisons to phylogeny and diversity) and his approach, which appeared to be entirely phylogenetically focused.


DNA, RNA… It’s Not All the Same

1

Had a frustrating morning not knowing quite where to pick up—continue struggling with the morphological/molecular distance plot or move on to the rest of the list. There was some amount of distraction, too, with the lab’s new intern, Sarah, an undergrad from France, arriving and needing some assistance getting settled it. Fortunately, I got an email back from Maude after lunch, introducing me to her labmate Allison, an expert in all things R and phylogeny. She sat down with my problem and was extremely helpful—she very quickly pointed out some pretty major things (retrospectively pretty obvious):

  1. I was trying to read an RNA sequence with a function called read.dna(). 
  2. DNA and RNA are not the same.
  3. The distance measures implemented in the dist.dna() function probably do not apply to RNA.

She pointed me toward the package {seqinr}, which includes a function read.alignment() that reads clustal files like mine at face value, including the U nucleotides. Hallelujah. She also pointed out another fact that was almost immediately obvious retrospectively: pairwise genetic distances computed directly from sequences are not the same as the genetic distances measured along branches of a tree (those are known as patristic distances). It might make more sense to use patristic distances, since they actually reflect the ‘evolutionary’ distances, at least in so far as the phylogeny is correct. This, however, would require obtaining the files with the trees themselves from Sorhannus and Medlin. Perhaps I will send them another email.

Anyway, this was quite an eye-opener of a conversation and a very stark reminder of how much better it is to ask for help rather than to just bash your head against the wall alone. Other people are invariably smarter than oneself. It eventually resulted in this plot, which looks a lot more reasonable:


Now this, I think, is something I can work with. The correlation is still quite weak, but it’s now not ridiculous, and it’s not binned, and there’s still some vague positive association between the two variables, which does make sense.