(Note, this assumes that you have a Django project installed and running. This example is for Django 1.3, the official version.)
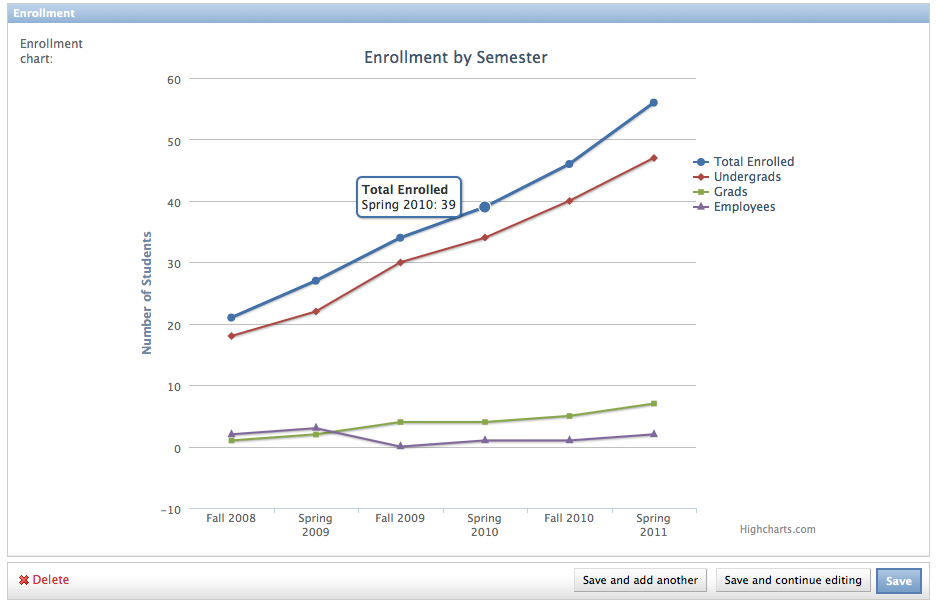
Below are some notes for adding Highcharts to a Django admin page. In this case, I want to chart the enrollment in a science class over time.
Specifically, I have a model name “Course” and I want to see the chart on the “Course” change form in the admin.
(1) Download Highcharts, unzip it, and place in a directory under your Django MEDIA_ROOT directory, as specified in your Django settings.py.
(2) Make a blank template file named “change_form.html” file as well as the appropriate directories for your model. In the case of my Course model, the location is:
../templates/admin/course/course/change_form.html
Notes on the path above:
“templates” – a directory specified in your django settings.py file
“admin” – indicates a template for the django admin
” course” – name of my app. (The Course model is defined in ‘../course/models.py’)
“course” – name of the model, Course, in lowercase
“change_form.html” – name of an existing file in the django source code (/django/contrib/admin/templates/admin/change_form.html)
(2) Add the following lines of code to your change_form.html file.
{% extends "admin/change_form.html" %}
{% block extrahead %}{{ block.super }}
{% url 'admin:jsi18n' as jsi18nurl %}
<script type="text/javascript" src="{{ jsi18nurl|default:"../../../jsi18n/" }}"></script>
{{ media }}
<!-- start: two new lines for highcharts -->
<script src="http://ajax.googleapis.com/ajax/libs/jquery/1.6.1/jquery.min.js" type="text/javascript"></script>
<script src="{{ MEDIA_URL }}highcharts/js/highcharts.js" type="text/javascript"></script>
<!-- end: two new lines for highcharts -->
{% endblock %}
Most of the code above is taken from the “extrahead” block in the original “change_form.html” file. Two new lines of javascript have been added, as indicated by the comments above. (Again, this is Django 1.3, the official version. If you’re using a different version, copy the appropriate code from the change_form.html template included with django.)
The 1st line calls in the JQuery library and the 2nd line connects to highcharts.js.
(3) Test. Go to the the Django admin and attempt to add a new instance of your model, or edit an existing one. View the source in your browser:
(a) Make sure that the new lines show up and that
(b) the javascript files are being loaded. (e.g., Click on the links to the jquery and highcharts js files to make sure they load.)
Note: Django 1.3 has JQuery built-in but it has it’s own namespace. Using the built-in JQuery requires editing highcharts.js and changing “JQuery” to “django.Jquery”. Because of maintenance, changing the highcharts.js is not advisable.
(4) For my Course model, I’m adding a function in the models.py file named “enrollment_chart”. For example purposes, I’m throwing test data into the function. (In reality, the function calls a queryset that is passed to the template.)
    def enrollment_chart(self):
        lu = { 'categories' : [ 'Fall 2008', 'Spring 2009','Fall 2009', 'Spring 2010', 'Fall 2010', 'Spring 2011'],\
             'undergrad' : [18, 22, 30, 34, 40, 47],\
             'grad' : [1, 2, 4, 4, 5, 7],\
             'employee' : [2, 3, 0, 1, 1, 2] }
        lu['total_enrolled'] = [sum(a) for a in zip(lu['undergrad'], lu['grad'],lu['employee'])]

        return render_to_string('admin/course/course/enrollment_chart.html', lu )
    enrollment_chart.allow_tags = True
(5) Make the “enrollment_chart.html” file referred to in the function above. Note, the file goes in the same directory as the “change_form.html” file in step (2).
(6) In the “enrollment_chart.html” file, add the following code:
Note 1: This code is from the highcharts example graph with some changes to the labels and the addition of Django template tags.
Note 2: the “renderTo” attribute must match the “id” of the <div ..> at the bottom of this code.
<script type="text/javascript">
var chart;
jQuery(document).ready(function() {
	chart = new Highcharts.Chart({
		chart: {
			renderTo: 'enrollment_container',
			defaultSeriesType: 'line',
			marginRight: 130,
			marginBottom: 30
		},
		title: {
			text: 'Enrollment by Semester ',
			x: -20 //center
		},
		subtitle: {
			text: '',
			x: -20
		},
		xAxis: {
			categories: [ '{{ categories|join:"','" }}']
		//	categories: ['Fall 2008', 'Spring 2009','Fall 2009', 'Spring 2010', 'Fall 2010', 'Spring 2011']
		},
		yAxis: {
			title: {
				text: 'Number of Students'
			},
			plotLines: [{
				value: 0,
				width: 1,
				color: '#808080'
			}]
		},
		tooltip: {
			formatter: function() {
	                return ''+ this.series.name +''+this.x +': '+ this.y;
			}
		},
		legend: {
			layout: 'vertical',
			align: 'right',
			verticalAlign: 'top',
			x: -10,
			y: 100,
			borderWidth: 0
		},
		series: [{
			name: 'Total Enrolled',
			//data: [1, 27, 34, 39, 46, 56]
			data: [{{ total_enrolled|join:"," }}]
		}, {
			name: 'Undergrads',
            data: [{{ undergrad|join:"," }}]
			//data: [18, 22, 30, 34, 40, 47]
		}, {
			name: 'Grads',
			data: [{{ grad|join:"," }}]
			//data: [1, 2, 4, 4, 5, 7]
		}, {
			name: 'Employees',
			data: [{{ employee|join:"," }}]
			//data: [2, 3, 0, 1, 1, 2]
		}]
	});

});
</script>
<div id="enrollment_container" style="width: 700px;height: 500px"></div>
(7) Update your admin.py file to connect the enrollment_chart() function in step (4) to your admin screen.
In the admin.py file, add enrollment_chart to:
(a) the list of readonly_fields, as well as
(b) a field in your fieldsets array
(Location of the admin.py file for the Course model: ../course/admin.py)
Below is an example where enrollment_chart has been added:
class CourseAdmin(admin.ModelAdmin):
    list_display = ( 'course_id', 'title', 'catalog_number', )
    search_fields = ( 'course_id', 'title', 'catalog_number', )
    list_filter = ('status',)

    readonly_fields = ('semester_details', 'enrollment_chart' )
    fieldsets = [
     ('Course', { 'fields':  [  'course_id', 'title', 'catalog_number', \
                    'department', 'course_type', 'status', ]}), \

    ('Semester Details', { 'fields':  [  'semester_details',  ]}),\
    ('Enrollment', { 'fields':  [  'enrollment_chart',  ]}),\
                    ]
admin.site.register(Course, CourseAdmin)
Summary
The explanation above is long, but, if you’re django instance is already running, the steps are fairly quick.
(a) Download Highcharts, unzip it, and place in a directory under your Django MEDIA_ROOT directory (step 1)
(b) Add two admin templates:
change_form.html – call the JQuery and the highcharts.js libraries (steps 2 and 3)
enrollment_chart.html – or another template to put the chart’s javascript + containing <div..> (steps 5 and 6)
(c) Create a function accessible by your model that passes chart data (step 4)
(d) Modify the admin.py to link the function to the django admin and a template (step 7)
Once the basics are going, you can start customizing your chart:)
Nice Article. But you can add the media files in the admin form, instead in the template.
I wrote a django app called Django-Chartit that can help plot charts with highcharts directly from your models in django. Please take a look and would appreciate any feedback. Thanks! http://bit.ly/rTCl1Y
i used django chartit but it doesnt display the graphs. it gives me a blank page while i run it in the browser and shows no errors too
Thank you very much for this great tutorial. It helped me a lot.
In django 1.7 there is no MEDIA_ROOT directory specified in the dettings.py file. Hence, where should I unzip the highcharts.
Also, could you explain a little more elaborate, giving the exact locations of files that need to be changed.
Thanks,
u rock 🙂