About Priya Kumar

Priya is a summer 2013 intern at the Berkman Center for Internet & Society. She studies data storytelling at the University of Michigan School of Information.

Law Enforcement and Mining Social Media: Where’s the Oversight?

A Pennsylvania detective had a nickname of a suspect, but no real name. He turned to Facebook, found a picture, and eventually apprehended the person. This anecdote from a Washington Post investigation into law enforcement use of facial recognition software illustrates how social media can be a boon for catching criminals.

As people share more about their thoughts and actions on social media and as algorithms grow more sophisticated, law enforcement’s ability to mine such information for clues into how to prevent crimes raises concerns of profiling and questions of oversight.

Law enforcement profiling predates social media. From 1956 to 1971, FBI counterintelligence program COINTELPRO tracked political organizations and their leaders, including Martin Luther King, Jr.

Recently, the ACLU’s “Mapping the FBI” project uncovered intelligence gathering that used racial and ethnic mapping. The project’s documentation includes a 2009 memo from the bureau’s Detroit office that called Michigan’s Middle East and Muslim community “prime territory for attempted radicalization and recruitment by” terrorist groups. The FBI’s reason: most State Department-labeled terrorist groups originate in the Middle East and South Asia.

In 2010 a 20-year-old Arab-American man in California found a tracking device on his car and learned the FBI had been surveilling him, a US citizen, for months, if not longer. Since 2011 the Associated Press has investigated the NYPD’s spying on Muslim communities, documenting what The Atlantic calls “horrifying effects” on both those surveilled, who have not been accused of any crimes, and on counterterrorism efforts as a whole—in six years, the program did not generate a single lead.

The NSA and British intelligence agency GCHQ collect raw Internet traffic that includes email, social media, and chats. US law enforcement agencies at all levels can obtain information from Internet and communication companies with court orders. But police don’t need permission to monitor what already flows freely on the web. Ars Technica reported on the London Metropolitan police’s extensive efforts to monitor social media:

For the past two years, a secretive unit in the Metropolitan Police has been developing the tools for blanket surveillance of the public’s social media conversations. Operating 24 hours a day, seven days a week, a staff of 17 officers in the National Domestic Extremism Unit (NDEU) has been scanning the public’s tweets, YouTube videos, Facebook profiles, and anything else UK citizens post in the public online sphere.

Several commercial tools exist to monitor social media streams, and companies actively market them to law enforcement.  Police departments at the University of Maryland, Hampton University, and the city of Boca Raton, Florida use tools from the Virginia-based technology company ECM Universe to surveil social media users and analyze the text of their messages. A brochure touts that with the tool,

[A] city can monitor activist groups who are using social media to organize their efforts on the ground and receive alerts in a matter of minutes from the time of the postings when dangerous radical elements emerge from the crowd.

Such language underscores the need for oversight on how to use information gathered from social media. Participating in an activist group is not a criminal activity, and “dangerous radical elements” do not emerge at every activist meeting.

US law enforcement generally needs a reason and court permission to investigate someone. Predictive analytics involves mining data to look for undetected or unconsidered patterns. Agencies “don’t necessarily know what they need to monitor on Twitter,” software company SAS wrote in a paper detailing its tools, one of which maps people’s friends and followers on Facebook and Twitter. Users maintain hundreds of connections on these sites, including people they may not have contacted for years or people they don’t even know. To what extent will a person’s connections implicate them?

Predictive policing has helped police departments lower crime. But such efforts used previously reported and anonymized crime data; inclusion of social media data adds another dimension of concern. People don’t know what governments are doing with troves of social media data, and people can’t see the algorithms that police use to fight crime. As Evgeny Morozov wrote, “If no one can examine the algorithms…we won’t know what biases and discriminatory practices are built into them.”

Twitter’s Geography: Visualized and Explained

Twitter’s CEO Dick Costolo has called the popular microblogging service “the pulse of the planet.” With a little less than eight percent of the world’s population on Twitter, that pulse has room to grow. Nevertheless, recent big data research into the geography of the Twittersphere sheds light on where users tweet, with whom they tweet, and what information they share. The findings illustrate that Twitter helps people transcend geographic boundaries that restricted communication in a pre-digital age.

A research team from the University of Illinois at Urbana-Champaign examined location data from the Twitter Decahose, which includes 10 percent of tweets sent on a given day. The team examined more than 1.5 billion tweets sent from more than 71 million unique users over 39 days and documented its findings in a paper published online.

Extracting Location from Tweets
Twitter displays the long-tail phenomenon of user participation: 85 percent of tweets come from the top 15 percent of users, and one-fifth of tweets come from just one percent of users. Only 3 percent of tweets are georeferenced, meaning their metadata includes location information. Echoing the long-tail, two-thirds of georeferenced tweets come from one percent of users, representing a small subset of Twitter users.

Researchers dramatically expanded the number of located tweets through geocoding. They analyzed information from user-generated Location and Profile fields and inferred location for more than one-third of tweets from the Decahose. These fields remain fairly static as a user tweets, so future researchers may be better off geocoding users rather than tweets. This could simplify location-based Twitter research by reducing the number of data points to analyze, saving time and computing power.

Though Twitter users communicate in a variety of languages (the most multilingual areas being Hungary, Serbia, Lebanon, Israel, and the West Bank), they tend to provide their location data in English.

Where Do People Tweet From?
Where electricity exists. The map below overlays georeferenced tweets with NASA Earth’s City Lights images. Red dots represent georeferenced tweets, blue dots represent access to electricity, and white dots represent an equal balance of tweets and electricity.

A map shows strong correlation between Twitter use and electricity accessibility.

Red dots represent georeferenced tweets, blue dots represent areas with electricity, and white dots represent both. Image via First Monday/Leetaru, et al. Click image for high-resolution version.

The map reminds us that accessibility to digital tools still relies on accessibility to tangible infrastructure, though the proclivity of red illustrates that people tweet even when electricity is scarce. (The box around Japan reflects some tweets from boats but is also the relic of old third-party Twitter clients that “handled the country’s polygonal shape a bit oddly,” Leetaru explained in an email).

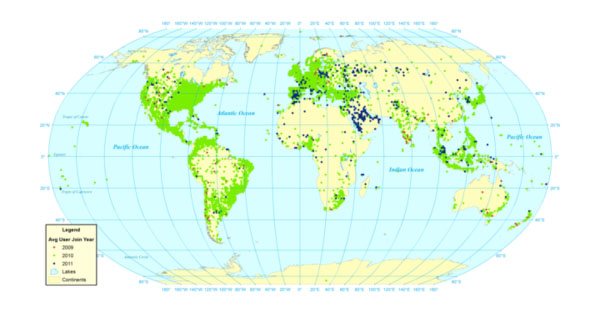
Most georeferenced Twitter users joined in 2010 (shown in green on the map below), with concentrations of European, Middle Eastern, and Southeast Asian users joining in 2011 (shown in blue on the map below).

A map shows the year when Twitter users joined the service.

Green dots represent georeferenced users who joined Twitter in 2010 and blue dots represent georeferenced users who joined in 2011. Image via First Monday/Leetaru, et al. Click image for high-resolution version.

Who Do People Communicate With on Twitter?

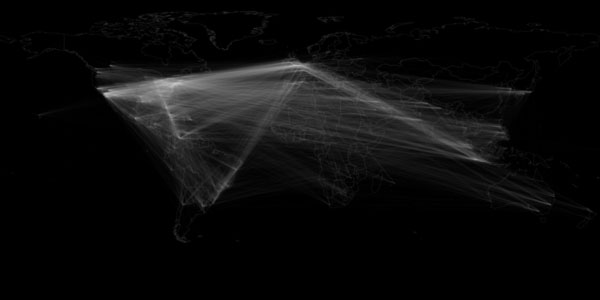
People on Twitter retweet and reference close-by and far-away users at almost equal rates. A map of geocoded retweets reveals patterns among continental communication. The researchers write:

“Latin America is more closely connected to Europe than to the United States, while Asia connects more closely to the U.S. and the Middle East connects to both the U.S. and Europe. The east coast of the United States is a clear nexus point for the country, through Europe appears to be more dominant than the United States in producing content retweeted by the rest of the world.”

A map showing the location connections between retweets.

This map shows the location connections between users who retweet other users. Image via First Monday/Leetaru, et al. Click image for high-resolution version.

Research from 2012 showed Twitter users tended to follow people geographically close to them and those located in areas easily accessible by flight. That paper examined pairs of followers, but the University of Illinois team maintains that retweets and references to other users are better indicators than followers of how much a user pays attention to another user’s tweets.

What Do People Share on Twitter?
Mostly social media. More than half of all links in tweets go to six domains: Twitter, Instagram, Facebook, YouTube, ask.fm, and Tumblr. Only 7.8 percent of all links people share on Twitter reference English mainstream news. The most popular sources for English-language news on Twitter include the BBC, Huffington Post, New York Times, and Guardian.

People link to articles about close-by and far-away news at almost equal rates. The map below compares regional references on Twitter and in Google News’ RSS feed. Blue dots represent more georeferenced Twitter coverage, red dots represent more mainstream media coverage, and white dots represent equal coverage.

This map compares Twitter and mainstream media coverage of areas around the world.

The blue dots represent Twitter coverage of an area and the red dots represent mainstream media coverage of an area. Image via First Monday/Leetaru, et al. Click image for high-resolution version.

Twitter appears to cover more information on Latin America and Eastern Europe, while mainstream media covers Africa, South Asia, and East Asia more thoroughly.

The most influential users, based on Klout score, concentrate in Malaysia, Indonesia, France, Spain, the U.K., the U.S. and Venezuela. The least influential, meaning those whose content is least likely to spread around the Web, reside in Eastern Europe, the Middle East (especially Turkey), India, and Southeast Asia.

Want to see more Twitter visualizations? The company crunches its own data and posts visualizations on its Flickr page.

Singapore Media License Requirement “Casts a Chill” on Free Expression

The Straits Times reported that more than 150 websites and blogs in Singapore went black yesterday to protest a new government-imposed licensing requirement that, “casts a chill over the city-state’s robust and free-wheeling online communities,” said Cynthia Wong, Human Rights Watch’s senior Internet researcher, in a statement.

Beginning June 1, the Media Development Authority requires websites that “report regularly on issues relating to Singapore” and attract more than 50,000 unique monthly visitors in Singapore obtain a license and put up an approximately USD$40,000 bond. If the MDA finds “prohibited content,” including that which “undermines racial or religious harmony,” the sites must remove it within 24 hours.

The MDA identified ten mainstream media outlets that must apply for the license, including Yahoo! Singapore, which calls the requirement unsettling. The government said the measure provides consistency with existing media regulations. Siew Kum Hong, a former presidentially appointed member of Parliament, disagreed with the assertion that the law creates parity with traditional forms of media, mentioning that newspapers found to publish prohibited content do not have to collect unsold copies within 24 hours.

The government also said the measure does not apply to blogs, though it does not rule out including blogs in the future. Netizens criticized the measure for its vague language and the lack of public consultation involved in its formation. Bloggers launched a #FreeMyInternet campaign and have scheduled a June 8 protest in Hong Lim Park. As of today more than 4,000 people have signed an online petition demanding the government withdraw the measure.

Tiananmen Square Anniversary: China Experiments with Subtle Censorship and Netizens Fight Back with Images

To ensure its country’s Internet remains in good working order, the Chinese government has used June 4 as an unofficial “Internet maintenance” day. In 2009, more than 300 sites went down. In 2010, a slew of blocked sites (many pornographic) became accessible. Last year, the Shanghai Stock Exchange Composite Index dropped 64.89 points, leading the popular Chinese microblogging service Sina Weibo to ban searches of related terms. Why such erratic behavior? June 4 also marks the day when, in 1989, tanks entered Tiananmen Square to violently quash pro-democracy protests.

Days before this year’s 24th anniversary of the Tiananmen Square massacre, Weibo experimented with a much subtler form of censorship, but Chinese netizens used creative images to signal their acknowledgement of what Chinese government wishes the country would forget.

Typically, users who search for sensitive terms such as “June 4th incident” receive the message, “According to relevant laws, regulations and policies, search results for [keyword] cannot be displayed.” Beginning on May 31, searches for “Tiananmen incident,” “24th anniversary,” “June 4th,” “64 incident” returned a sanitized list, for example, referencing a 1976 protest that occurred in Tiananmen Square, or a seemingly innocuous message that the search yielded no results, according to analysis from the Chinese Internet transparency organization GreatFire.org.

By the evening of June 3, Weibo reverted to displaying its original censorship announcement in response to searches of sensitive terms. Citizen Lab posted a list of 71 terms blocked on Weibo, many variations on the numbers six, four, and 1989. China Digital Times mentioned additional terms including names of people and places.

The seemingly benign terms “today,” “tonight,” “big yellow duck,” and “black shirt” also faced restriction on Weibo. The latter two reference an online meme and calls for Chinese to wear black shirts to observe the anniversary.

While Weibo’s text filters grow ever more sophisticated, the network seems less able to police images. Chinese netizens exploited this fact, posting variations of the iconic “Tank Man” image. One replaced the tanks with yellow rubber ducks (hence the blockage of “big yellow duck”); one showed a cow in front of a line of bulldozers; another showed a praying mantis pushing against a wheel, referencing a popular idiom about the futility of trying to stop the future.

On May 31, the Chinese government also cut off access to the encrypted (https) version of Wikipedia, which Chinese Internet users could use to see articles banned on the unencrypted (http) version.